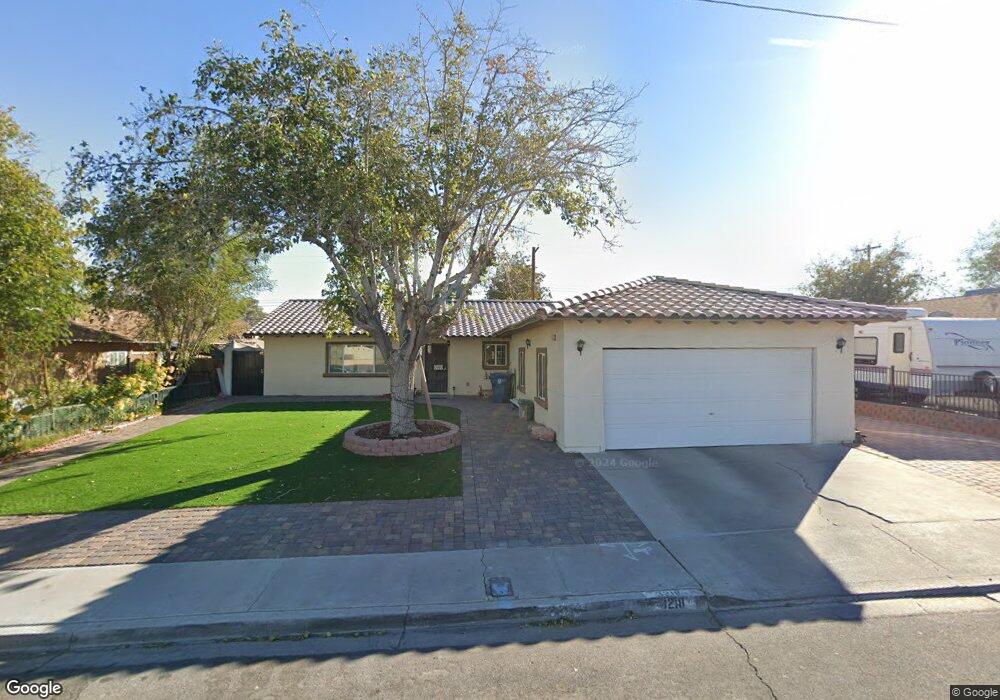
3218 Glenhurst Dr Las Vegas, NV 89121
Estimated Value: $362,000 - $422,000
4
Beds
2
Baths
1,674
Sq Ft
$237/Sq Ft
Est. Value
About This Home
This home is located at 3218 Glenhurst Dr, Las Vegas, NV 89121 and is currently estimated at $396,062, approximately $236 per square foot. 3218 Glenhurst Dr is a home located in Clark County with nearby schools including Will Beckley Elementary School, Jerome Mack Middle School, and Chaparral High School.
Ownership History
Date
Name
Owned For
Owner Type
Purchase Details
Closed on
Jan 24, 2017
Sold by
Vega Sanchez Hector G and Vega Norma A
Bought by
Vega Sanchez Hector G and Vega Norma A
Current Estimated Value
Home Financials for this Owner
Home Financials are based on the most recent Mortgage that was taken out on this home.
Original Mortgage
$100,000
Outstanding Balance
$50,455
Interest Rate
4.16%
Mortgage Type
New Conventional
Estimated Equity
$345,607
Purchase Details
Closed on
Oct 25, 1999
Sold by
Vanhulzen Jeffrey J and Vanhulzen Karren L
Bought by
Vega Hector and Guzman Norma A
Home Financials for this Owner
Home Financials are based on the most recent Mortgage that was taken out on this home.
Original Mortgage
$118,817
Interest Rate
7.95%
Mortgage Type
FHA
Purchase Details
Closed on
Jun 2, 1995
Sold by
Hud
Bought by
Vanhulzen Jeffrey J and Vanhulzen Karren L
Purchase Details
Closed on
Dec 20, 1994
Sold by
Butler Robert H and Butler Rosemarie
Bought by
Hud
Create a Home Valuation Report for This Property
The Home Valuation Report is an in-depth analysis detailing your home's value as well as a comparison with similar homes in the area
Home Values in the Area
Average Home Value in this Area
Purchase History
| Date | Buyer | Sale Price | Title Company |
|---|---|---|---|
| Vega Sanchez Hector G | -- | Chicago Title Of Nevada | |
| Vega Hector | $119,000 | Stewart Title | |
| Vanhulzen Jeffrey J | -- | Stewart Title | |
| Hud | $96,705 | First American Title Company |
Source: Public Records
Mortgage History
| Date | Status | Borrower | Loan Amount |
|---|---|---|---|
| Open | Vega Sanchez Hector G | $100,000 | |
| Closed | Vega Hector | $118,817 |
Source: Public Records
Tax History Compared to Growth
Tax History
| Year | Tax Paid | Tax Assessment Tax Assessment Total Assessment is a certain percentage of the fair market value that is determined by local assessors to be the total taxable value of land and additions on the property. | Land | Improvement |
|---|---|---|---|---|
| 2025 | $1,355 | $62,404 | $28,350 | $34,054 |
| 2024 | $1,256 | $62,404 | $28,350 | $34,054 |
| 2023 | $874 | $65,335 | $34,650 | $30,685 |
| 2022 | $1,216 | $53,385 | $25,900 | $27,485 |
| 2021 | $1,126 | $48,989 | $23,450 | $25,539 |
| 2020 | $1,043 | $48,973 | $24,150 | $24,823 |
| 2019 | $977 | $43,488 | $19,600 | $23,888 |
| 2018 | $932 | $39,777 | $17,150 | $22,627 |
| 2017 | $1,143 | $38,967 | $16,450 | $22,517 |
| 2016 | $874 | $35,750 | $11,550 | $24,200 |
| 2015 | $871 | $33,814 | $9,100 | $24,714 |
| 2014 | $846 | $29,665 | $7,000 | $22,665 |
Source: Public Records
Map
Nearby Homes
- 3258 Glenhurst Dr
- 3169 Nottingham Dr
- 3318 Bancroft Cir
- 3558 Wayne Cir
- 241 Pecos Way Unit 6
- 3361 Horizon St
- 233 Pecos Way
- 275 Pecos Way
- 3078 S Pecos Rd
- 3085 Greenbriar Dr
- 3378 Del Marino St
- 3247 Greenbriar Dr
- 3410 Pecos Way
- 3435 Don Miguel Dr
- 3370 Dunham Ct
- 3499 Middlebury Ave
- 3386 El Camino Real
- 3428 Don Miguel Dr
- 3535 Middlebury Ave
- 747 Greenbriar Townhouse Way
- 3228 Glenhurst Dr
- 3208 Glenhurst Dr
- 3213 Nottingham Dr
- 3223 Nottingham Dr
- 3203 Nottingham Dr
- 3238 Glenhurst Dr
- 3198 Glenhurst Dr
- 3233 Nottingham Dr
- 3193 Nottingham Dr
- 3188 Glenhurst Dr
- 3248 Glenhurst Dr
- 3243 Nottingham Dr
- 3214 Nottingham Dr
- 3224 Nottingham Dr
- 3204 Nottingham Dr
- 3234 Nottingham Dr
- 3178 Glenhurst Dr
- 3257 Nottingham Dr
- 3194 Nottingham Dr