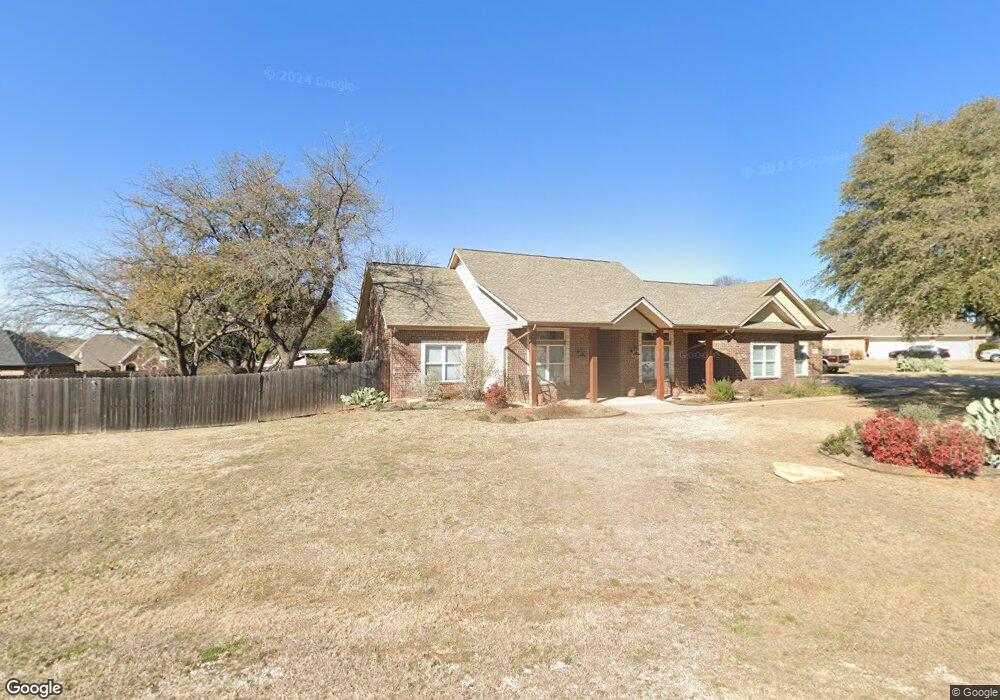
3218 Golden Oaks Cir Granbury, TX 76049
Estimated Value: $546,414 - $606,000
3
Beds
4
Baths
2,613
Sq Ft
$219/Sq Ft
Est. Value
About This Home
This home is located at 3218 Golden Oaks Cir, Granbury, TX 76049 and is currently estimated at $573,104, approximately $219 per square foot. 3218 Golden Oaks Cir is a home located in Hood County with nearby schools including Acton Elementary School, Acton Middle School, and Granbury High School.
Ownership History
Date
Name
Owned For
Owner Type
Purchase Details
Closed on
Aug 29, 2014
Sold by
Teacle Jon C and Teacle Crystal
Bought by
Mathers Stephen R and Mathers Randee K
Current Estimated Value
Home Financials for this Owner
Home Financials are based on the most recent Mortgage that was taken out on this home.
Original Mortgage
$254,600
Outstanding Balance
$194,422
Interest Rate
4.15%
Mortgage Type
New Conventional
Estimated Equity
$378,682
Purchase Details
Closed on
Feb 4, 2008
Sold by
Williamson Gerald T and Williamson Bobbie A
Bought by
Teacle Jon C and Teacle Crystal
Home Financials for this Owner
Home Financials are based on the most recent Mortgage that was taken out on this home.
Original Mortgage
$292,634
Interest Rate
6.15%
Mortgage Type
Purchase Money Mortgage
Purchase Details
Closed on
Jan 7, 2004
Sold by
Marley Investments Llp
Bought by
Mathers Stephen R and Mathers Randee K
Purchase Details
Closed on
May 10, 2000
Bought by
Mathers Stephen R and Mathers Randee K
Create a Home Valuation Report for This Property
The Home Valuation Report is an in-depth analysis detailing your home's value as well as a comparison with similar homes in the area
Home Values in the Area
Average Home Value in this Area
Purchase History
| Date | Buyer | Sale Price | Title Company |
|---|---|---|---|
| Mathers Stephen R | -- | Central Texas Title | |
| Teacle Jon C | -- | Central Texas Title | |
| Mathers Stephen R | -- | -- | |
| Mathers Stephen R | -- | -- |
Source: Public Records
Mortgage History
| Date | Status | Borrower | Loan Amount |
|---|---|---|---|
| Open | Mathers Stephen R | $254,600 | |
| Previous Owner | Teacle Jon C | $292,634 |
Source: Public Records
Tax History Compared to Growth
Tax History
| Year | Tax Paid | Tax Assessment Tax Assessment Total Assessment is a certain percentage of the fair market value that is determined by local assessors to be the total taxable value of land and additions on the property. | Land | Improvement |
|---|---|---|---|---|
| 2025 | $2,298 | $523,974 | $45,000 | $512,940 |
| 2024 | $2,369 | $476,340 | $45,000 | $431,340 |
| 2023 | $5,456 | $486,730 | $45,000 | $441,730 |
| 2022 | $4,000 | $451,300 | $30,000 | $421,300 |
| 2021 | $5,456 | $355,410 | $30,000 | $325,410 |
| 2020 | $5,158 | $332,140 | $36,000 | $296,140 |
| 2019 | $5,171 | $318,040 | $36,000 | $282,040 |
| 2018 | $4,709 | $289,660 | $36,000 | $253,660 |
| 2017 | $4,732 | $282,950 | $36,000 | $246,950 |
| 2016 | $4,525 | $270,600 | $36,000 | $234,600 |
| 2015 | $4,405 | $265,860 | $36,000 | $229,860 |
| 2014 | $4,405 | $265,860 | $36,000 | $229,860 |
Source: Public Records
Map
Nearby Homes
- 3218 Fountain Way
- 3207 Hummingbird Ct
- 2925 Willow Ridge Cir
- 4920 Centre Ct
- 4512 Cimmaron Trail
- 2936 Willow Ridge Cir
- 3510 Fountain Way
- 2918 James Rd
- 3119 Bob White Dr
- 1141 Avery Rd
- 1144 Avery Rd
- 1136 Avery Rd
- 5003 Bueno Dr
- 3707 Bob White Dr
- 2445 Bob White Dr
- 4410 Halo Ct
- 5102 Largo Dr
- 4312 Rhea Rd
- 3609 Upper Lake Cir
- 4363 Acton Hwy
- 3226 Golden Oaks Cir
- 3234 Golden Oaks Cir
- 3210 Golden Oaks Cir
- 3219 Golden Oaks Cir
- 3217 Golden Oaks Cir
- 3221 Golden Oaks Cir
- 3215 Golden Oaks Cir
- 3208 Golden Oaks Cir
- 3211 Golden Oaks Cir
- 3213 Golden Oaks Cir
- 3233 Golden Oaks Cir
- 3223 Golden Oaks Cir
- 3236 Golden Oaks Cir
- 3231 Golden Oaks Cir
- 3209 Golden Oaks Cir
- 3235 Golden Oaks Cir
- 3206 Golden Oaks Cir
- 3207 Golden Oaks Cir
- 3225 Golden Oaks Cir
- 3227 Crossbridge Cir