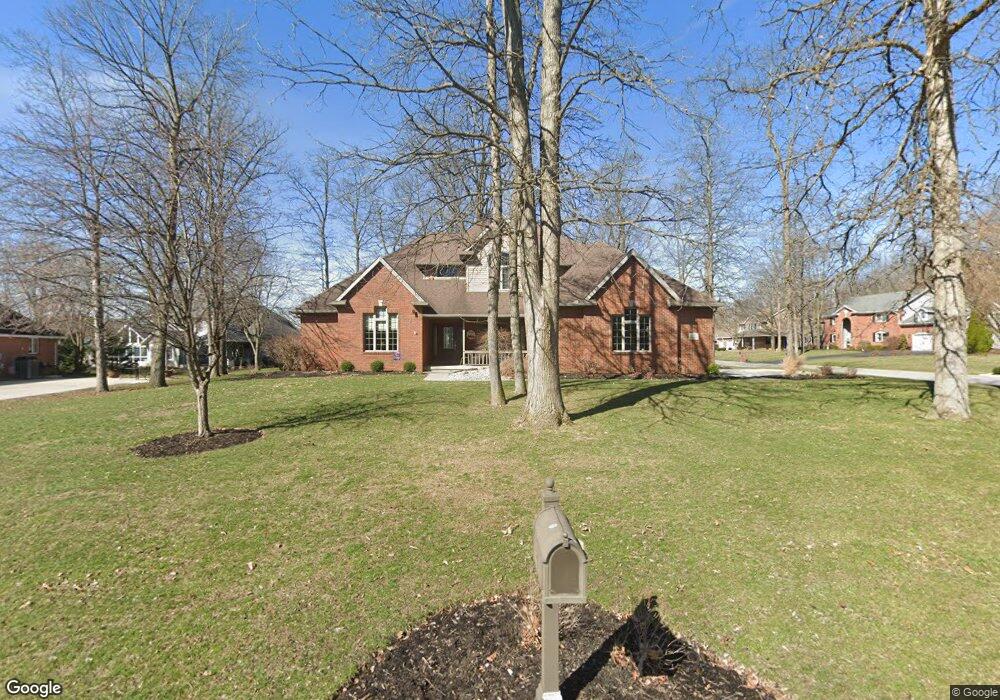
3218 Turnberry Dr Findlay, OH 45840
Estimated Value: $384,000 - $582,740
4
Beds
4
Baths
2,840
Sq Ft
$183/Sq Ft
Est. Value
About This Home
This home is located at 3218 Turnberry Dr, Findlay, OH 45840 and is currently estimated at $519,185, approximately $182 per square foot. 3218 Turnberry Dr is a home located in Hancock County with nearby schools including Liberty-Benton Elementary School, Liberty-Benton Middle School, and Liberty-Benton High School.
Ownership History
Date
Name
Owned For
Owner Type
Purchase Details
Closed on
Nov 27, 2019
Sold by
Edel John E and Edel Deborah L
Bought by
Edel John E and Edel Deborah L
Current Estimated Value
Purchase Details
Closed on
Jun 21, 2019
Sold by
Sherick Myles W
Bought by
Edel John E and Edel Deborah L
Home Financials for this Owner
Home Financials are based on the most recent Mortgage that was taken out on this home.
Original Mortgage
$307,125
Outstanding Balance
$262,175
Interest Rate
2.75%
Mortgage Type
Adjustable Rate Mortgage/ARM
Estimated Equity
$257,010
Purchase Details
Closed on
Mar 21, 2006
Sold by
Sherick Myles W and Sherick Patricia A
Bought by
Sherick Myles W
Purchase Details
Closed on
Sep 23, 1993
Bought by
Sherick Myles W and Sherick Patricia A
Purchase Details
Closed on
Jul 28, 1993
Bought by
Findlay Hillcrest Golf Crs
Create a Home Valuation Report for This Property
The Home Valuation Report is an in-depth analysis detailing your home's value as well as a comparison with similar homes in the area
Home Values in the Area
Average Home Value in this Area
Purchase History
| Date | Buyer | Sale Price | Title Company |
|---|---|---|---|
| Edel John E | -- | None Available | |
| Edel John E | $204,767 | Golden Key Title Agency | |
| Edel John E | $204,767 | Golden Key Title Agency | |
| Sherick Myles W | -- | None Available | |
| Sherick Patricia A | -- | None Available | |
| Sherick Myles W | $33,500 | -- | |
| Findlay Hillcrest Golf Crs | -- | -- |
Source: Public Records
Mortgage History
| Date | Status | Borrower | Loan Amount |
|---|---|---|---|
| Open | Edel John E | $307,125 |
Source: Public Records
Tax History Compared to Growth
Tax History
| Year | Tax Paid | Tax Assessment Tax Assessment Total Assessment is a certain percentage of the fair market value that is determined by local assessors to be the total taxable value of land and additions on the property. | Land | Improvement |
|---|---|---|---|---|
| 2024 | $6,439 | $173,210 | $20,020 | $153,190 |
| 2023 | $6,287 | $173,210 | $20,020 | $153,190 |
| 2022 | $6,226 | $173,210 | $20,020 | $153,190 |
| 2021 | $5,739 | $140,950 | $20,010 | $120,940 |
| 2020 | $5,767 | $140,450 | $20,010 | $120,440 |
| 2019 | $5,533 | $140,450 | $20,010 | $120,440 |
| 2018 | $4,235 | $118,680 | $14,300 | $104,380 |
| 2017 | $4,370 | $118,680 | $14,300 | $104,380 |
| 2016 | $4,233 | $118,730 | $14,300 | $104,430 |
| 2015 | $4,165 | $113,750 | $15,090 | $98,660 |
| 2014 | $4,203 | $113,750 | $15,090 | $98,660 |
| 2012 | $4,389 | $113,750 | $15,090 | $98,660 |
Source: Public Records
Map
Nearby Homes
- 1405 Cypress Lake
- 3106 Saddlebrook
- 3018 Gleneagle Dr
- 6535 Silver Lake Dr
- 1310 Muirfield Dr
- 0 Bushwillow Dr Or Rock Candy Rd Unit Lot 157
- 0 Rock Candy Rd Or Bushwillow Dr Unit Lot 173
- 0 Bearcat Way Or Rock Candy Rd Unit Lot 167
- 0 Rock Candy Rd Unit Lot 159
- 0 Rock Candy Rd Unit Lot 170
- 0 Rock Candy Rd Unit Lot 172 206819
- 0 Rock Candy Rd Unit Lot 162
- 0 Rock Candy Rd Unit Lot 171
- 0 Rock Candy Rd Unit Lot 168
- 0 County Road 95 Unit 6097574
- 933 Laurel Ln
- 0 Allen Township 142
- 0 Township Highway 99
- 12325 Township Highway 99
- 3300 Crosshill Dr
- 3212 Turnberry Dr
- 0 Turnberry Dr Unit H127570
- 0 Turnberry Dr Unit H137348
- 3217 Heathbrook Ct
- 3209 Heathbrook Ct
- 3200 Turnberry Dr
- 1419 Forest Park
- 1500 Forest Park
- 3206 Turnberry Dr
- 1508 Forest Park
- 1418 Forest Park
- 3201 Heathbrook Ct
- 1516 Forest Park
- 1413 Forest Park
- 3207 Turnberry Dr
- 3310 Turnberry Dr
- 1601 Forest Park
- 1412 Forest Park
- 1600 Forest Park
- 1475 Silver Pine Ln