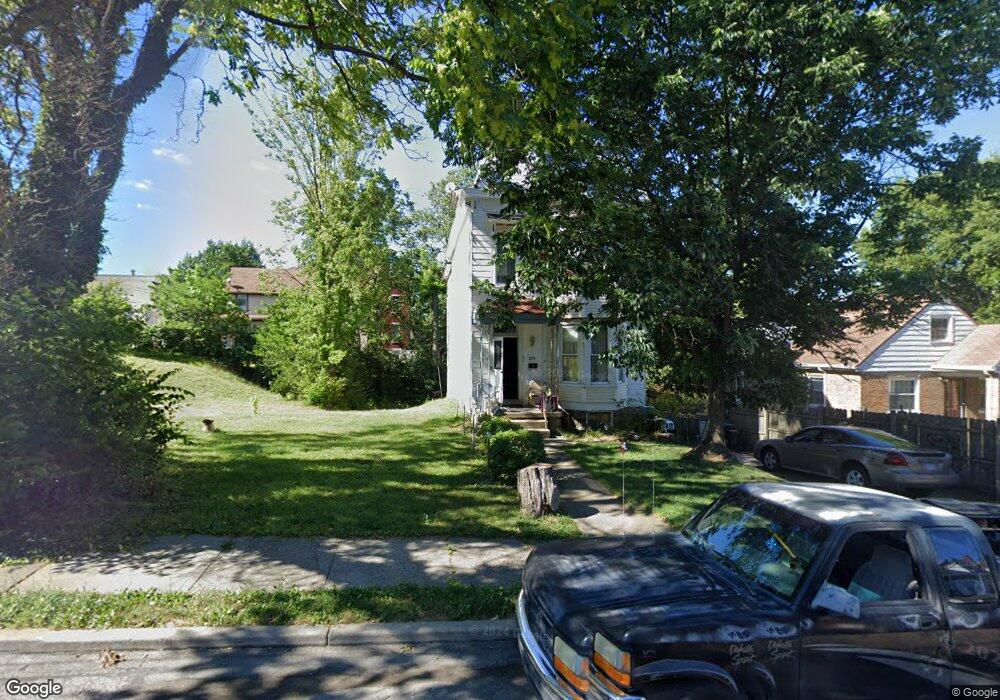
3218 W 8th St Cincinnati, OH 45205
East Price Hill NeighborhoodEstimated Value: $32,029 - $183,000
3
Beds
1
Bath
1,736
Sq Ft
$50/Sq Ft
Est. Value
About This Home
This home is located at 3218 W 8th St, Cincinnati, OH 45205 and is currently estimated at $86,507, approximately $49 per square foot. 3218 W 8th St is a home located in Hamilton County with nearby schools including Gilbert A. Dater High School, Robert A. Taft Information Technology High School, and Western Hills High School.
Ownership History
Date
Name
Owned For
Owner Type
Purchase Details
Closed on
Apr 22, 2021
Sold by
Jones Sean
Bought by
M&M Property Contractors Llc
Current Estimated Value
Home Financials for this Owner
Home Financials are based on the most recent Mortgage that was taken out on this home.
Interest Rate
2.97%
Purchase Details
Closed on
Apr 15, 2021
Sold by
Jones Sean
Bought by
M & M Property Contractors Llc
Home Financials for this Owner
Home Financials are based on the most recent Mortgage that was taken out on this home.
Interest Rate
2.97%
Purchase Details
Closed on
Jul 26, 2019
Sold by
Hamilton County
Bought by
Jones Sean
Purchase Details
Closed on
Jul 11, 1995
Sold by
Mulholland Anne M
Bought by
Yanke Orville H
Home Financials for this Owner
Home Financials are based on the most recent Mortgage that was taken out on this home.
Original Mortgage
$36,750
Interest Rate
8.87%
Mortgage Type
VA
Create a Home Valuation Report for This Property
The Home Valuation Report is an in-depth analysis detailing your home's value as well as a comparison with similar homes in the area
Home Values in the Area
Average Home Value in this Area
Purchase History
| Date | Buyer | Sale Price | Title Company |
|---|---|---|---|
| M&M Property Contractors Llc | $100 | -- | |
| M & M Property Contractors Llc | $1,000 | None Available | |
| Jones Sean | -- | None Available | |
| Yanke Orville H | -- | -- |
Source: Public Records
Mortgage History
| Date | Status | Borrower | Loan Amount |
|---|---|---|---|
| Closed | M&M Property Contractors Llc | -- | |
| Previous Owner | Yanke Orville H | $36,750 |
Source: Public Records
Tax History Compared to Growth
Tax History
| Year | Tax Paid | Tax Assessment Tax Assessment Total Assessment is a certain percentage of the fair market value that is determined by local assessors to be the total taxable value of land and additions on the property. | Land | Improvement |
|---|---|---|---|---|
| 2024 | $115 | $1,705 | $1,705 | -- |
| 2023 | $115 | $1,705 | $1,705 | $0 |
| 2022 | $114 | $1,509 | $1,509 | $0 |
| 2021 | $110 | $1,509 | $1,509 | $0 |
| 2020 | $5,627 | $1,509 | $1,509 | $0 |
| 2019 | $6,017 | $1,372 | $1,372 | $0 |
| 2018 | $6,621 | $10,843 | $1,372 | $9,471 |
| 2017 | $2,049 | $10,843 | $1,372 | $9,471 |
| 2016 | $1,446 | $11,824 | $1,530 | $10,294 |
| 2015 | $762 | $11,824 | $1,530 | $10,294 |
| 2014 | $1,998 | $11,824 | $1,530 | $10,294 |
| 2013 | $804 | $12,191 | $1,579 | $10,612 |
Source: Public Records
Map
Nearby Homes
- 817 Considine Ave
- 817 Hawthorne Ave
- 723 Considine Ave
- 725 Purcell Ave
- 3425 Eighth St W
- 3424 Price Ave
- 3427 Eighth St W
- 720 Grand Ave
- 2810 Eighth St W
- 658 Hawthorne Ave
- 812 Fairbanks Ave
- 810 Summit Ave
- 2711 Price Ave
- 924 Fairbanks Ave
- 922 Summit Ave
- 716 Fairbanks Ave
- 543 Considine Ave
- 541 Considine Ave
- 942 Summit Ave
- 1013 Del Monte Place
- 3218 W 8th St Unit 3220
- 3216 W 8th St
- 3220 W 8 Th St
- 3220 W 8th St
- 3220 Eighth St W
- 3214 W 8th St
- 812 Purcell Ave
- 814 Purcell Ave
- 816 Purcell Ave
- 803 Purcell Ave
- 811 Purcell Ave
- 3219 W 8th St
- 3217 W 8th St
- 818 Purcell Ave
- 3215 Eighth St W
- 801 Considine Ave
- 3215 W 8th St
- 811 Considine Ave
- 757 Purcell Ave
- 3209 Eighth St W