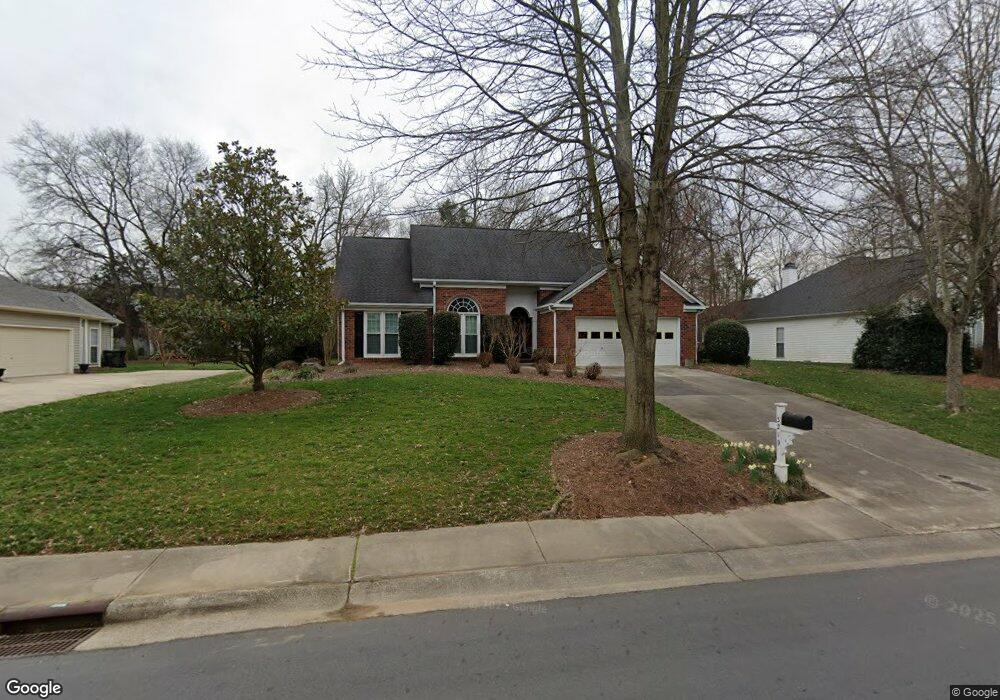
3219 Chatfield Ln SW Concord, NC 28027
Estimated Value: $430,000 - $454,000
4
Beds
3
Baths
2,306
Sq Ft
$190/Sq Ft
Est. Value
About This Home
This home is located at 3219 Chatfield Ln SW, Concord, NC 28027 and is currently estimated at $438,233, approximately $190 per square foot. 3219 Chatfield Ln SW is a home located in Cabarrus County with nearby schools including Wolf Meadow Elementary School, Roberta Road Middle School, and Dogwood Classical Academy.
Ownership History
Date
Name
Owned For
Owner Type
Purchase Details
Closed on
Sep 28, 2022
Sold by
Trask Kimberly K and Trask Adam G
Bought by
Baker Colby H and Baker Yvonne
Current Estimated Value
Home Financials for this Owner
Home Financials are based on the most recent Mortgage that was taken out on this home.
Original Mortgage
$297,500
Outstanding Balance
$284,356
Interest Rate
5.13%
Mortgage Type
New Conventional
Estimated Equity
$153,877
Purchase Details
Closed on
May 25, 2005
Sold by
Jardine Mark C and Jardine Kimberly G
Bought by
Green Eric J and Green Karen E
Home Financials for this Owner
Home Financials are based on the most recent Mortgage that was taken out on this home.
Original Mortgage
$155,200
Interest Rate
5.8%
Mortgage Type
Fannie Mae Freddie Mac
Purchase Details
Closed on
Aug 1, 1995
Bought by
Jardine Mark C
Create a Home Valuation Report for This Property
The Home Valuation Report is an in-depth analysis detailing your home's value as well as a comparison with similar homes in the area
Home Values in the Area
Average Home Value in this Area
Purchase History
| Date | Buyer | Sale Price | Title Company |
|---|---|---|---|
| Baker Colby H | $427,500 | -- | |
| Green Eric J | $194,000 | -- | |
| Jardine Mark C | $163,500 | -- |
Source: Public Records
Mortgage History
| Date | Status | Borrower | Loan Amount |
|---|---|---|---|
| Open | Baker Colby H | $297,500 | |
| Previous Owner | Green Eric J | $155,200 | |
| Closed | Green Eric J | $19,400 |
Source: Public Records
Tax History Compared to Growth
Tax History
| Year | Tax Paid | Tax Assessment Tax Assessment Total Assessment is a certain percentage of the fair market value that is determined by local assessors to be the total taxable value of land and additions on the property. | Land | Improvement |
|---|---|---|---|---|
| 2025 | $3,796 | $381,090 | $70,000 | $311,090 |
| 2024 | $3,796 | $381,090 | $70,000 | $311,090 |
| 2023 | $3,091 | $253,320 | $55,000 | $198,320 |
| 2022 | $3,091 | $253,320 | $55,000 | $198,320 |
| 2021 | $3,091 | $253,320 | $55,000 | $198,320 |
| 2020 | $3,091 | $253,320 | $55,000 | $198,320 |
| 2019 | $2,529 | $207,320 | $32,000 | $175,320 |
| 2018 | $2,488 | $207,320 | $32,000 | $175,320 |
| 2017 | $2,446 | $207,320 | $32,000 | $175,320 |
| 2016 | $1,451 | $187,670 | $23,000 | $164,670 |
| 2015 | $2,215 | $187,670 | $23,000 | $164,670 |
| 2014 | $2,215 | $187,670 | $23,000 | $164,670 |
Source: Public Records
Map
Nearby Homes
- 3141 Yates Mill Dr SW
- 3807 Bent Creek Dr SW
- 3811 Bent Creek Dr SW
- 4370 Coddle Creek Dr
- 3333 Roberta Rd
- 3369 Roberta Rd
- 3133 Roberta Rd
- 3455 Roberta Rd
- 5366 Hardister Place
- 3913 Stough Rd
- 3011 Langhorne Ave SW
- 4104 Pebblebrook Cir SW
- 4349 Roberta Rd
- 287 Halton Crossing Dr SW
- 3174 Farmwood Blvd SW Unit 154
- 3673 Farm Lake Dr SW
- 1398 Kent Downs Ave SW Unit 52
- 2694 Woodcrest Dr SW
- 193 Halton Crossing Dr SW
- 4114 Carolina Pointe Ct SW
- 3219 Chatfield Ln SW
- 3223 Chatfield Ln SW
- 3215 Chatfield Ln SW
- 3220 Roberta Farms Ct SW
- 3234 Dunmore Ct SW
- 3224 Roberta Farms Ct SW
- 3227 Chatfield Ln SW
- 3230 Dunmore Ct SW
- 3216 Roberta Farms Ct SW
- 3222 Chatfield Ln SW
- 3218 Chatfield Ln SW
- 3228 Roberta Farms Ct SW
- 3231 Chatfield Ln SW
- 3226 Dunmore Ct SW
- 3230 Chatfield Ln SW
- 3235 Chatfield Ln SW
- 3210 Chatfield Ln SW
- 3210 Chatfield Ln SW Unit Lt 9
- 3221 Roberta Farms Ct SW
- 3232 Roberta Farms Ct SW