
Seller's Agent in 2013
Mike Buscher
The Real Estate Group, Inc.
(217) 553-5958
7 Total Sales

Estimated Value: $116,471 - $137,000
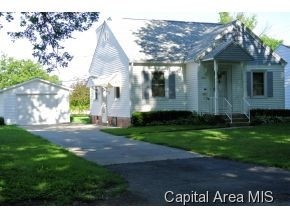
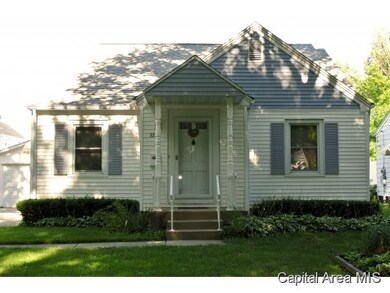
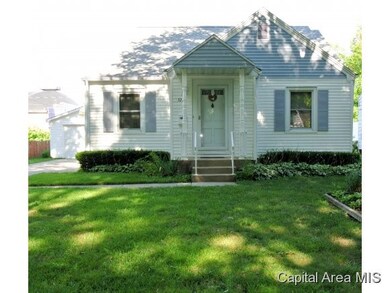
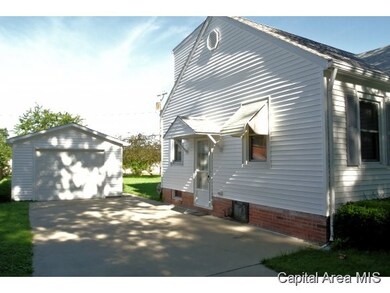
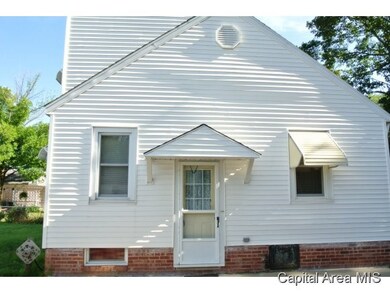
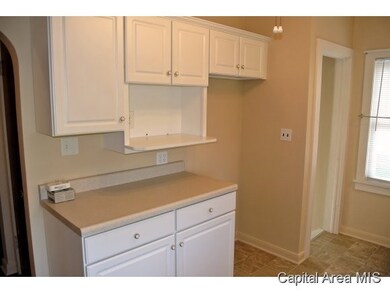
-Sharp & Updated 3 bedroom 1.5 story home. Large bedroom on second level. This home has a updated kitchen, updated siding, new gutters in 2005, roof updated in 2007, New hot water heater in 2009, New furnace in 2009, New A/C in 2009. Hardwood floors on main level, Fresh paint. Newer garage with nice backyard.
Last Agent to Sell the Property
The Real Estate Group, Inc. License #471000541 Listed on: 07/25/2013
| Date | Buyer | Sale Price | Title Company |
|---|---|---|---|
| -- | $71,500 | -- | |
| -- | $92,000 | -- |
| Date | Event | Price | List to Sale | Price per Sq Ft |
|---|---|---|---|---|
| 12/13/2013 12/13/13 | Sold | $71,500 | -22.3% | $65 / Sq Ft |
| 12/02/2013 12/02/13 | Pending | -- | -- | -- |
| 07/25/2013 07/25/13 | For Sale | $92,000 | -- | $83 / Sq Ft |
| Year | Tax Paid | Tax Assessment Tax Assessment Total Assessment is a certain percentage of the fair market value that is determined by local assessors to be the total taxable value of land and additions on the property. | Land | Improvement |
|---|---|---|---|---|
| 2024 | $2,303 | $34,473 | $6,715 | $27,758 |
| 2023 | $2,227 | $31,920 | $6,218 | $25,702 |
| 2022 | $2,110 | $30,207 | $5,884 | $24,323 |
| 2021 | $2,017 | $29,023 | $5,653 | $23,370 |
| 2020 | $1,839 | $28,707 | $5,591 | $23,116 |
| 2019 | $1,764 | $28,205 | $5,493 | $22,712 |
| 2018 | $1,702 | $28,084 | $5,469 | $22,615 |
| 2017 | $1,654 | $27,653 | $5,385 | $22,268 |
| 2016 | $1,592 | $26,939 | $5,246 | $21,693 |
| 2015 | $1,553 | $26,331 | $5,128 | $21,203 |
| 2014 | $1,522 | $26,111 | $5,085 | $21,026 |
| 2013 | $1,504 | $26,390 | $5,139 | $21,251 |
Seller's Agent in 2013
Mike Buscher
The Real Estate Group, Inc.
(217) 553-5958
7 Total Sales
Buyer's Agent in 2013
Betty Shuster
RE/MAX Professionals
(217) 652-3959
205 Total Sales
Source: RMLS Alliance
MLS Number: RMACA134092
APN: 22-14.0-106-014
Disclaimer: Certain information contained herein is derived from information provided by parties other than Homes.com. All information provided is deemed reliable, but is not guaranteed to be accurate and should be independently verified.
![]() Based on information submitted to the MLS GRID. All data is obtained from various sources and may not have been verified by broker or MLS GRID. Supplied Open House Information is subject to change without notice. All information should be independently reviewed and verified for accuracy. Properties may or may not be listed by the office/agent presenting the information. Some IDX listings have been excluded from this website.IDX information is provided exclusively for personal, non-commercial use, and may not be used for any purpose other than to identify prospective properties consumers may be interested in purchasing. Information is deemed reliable but not guaranteed.
Based on information submitted to the MLS GRID. All data is obtained from various sources and may not have been verified by broker or MLS GRID. Supplied Open House Information is subject to change without notice. All information should be independently reviewed and verified for accuracy. Properties may or may not be listed by the office/agent presenting the information. Some IDX listings have been excluded from this website.IDX information is provided exclusively for personal, non-commercial use, and may not be used for any purpose other than to identify prospective properties consumers may be interested in purchasing. Information is deemed reliable but not guaranteed.
Based on information submitted to the MLS GRID
Ask me questions while you tour the home.