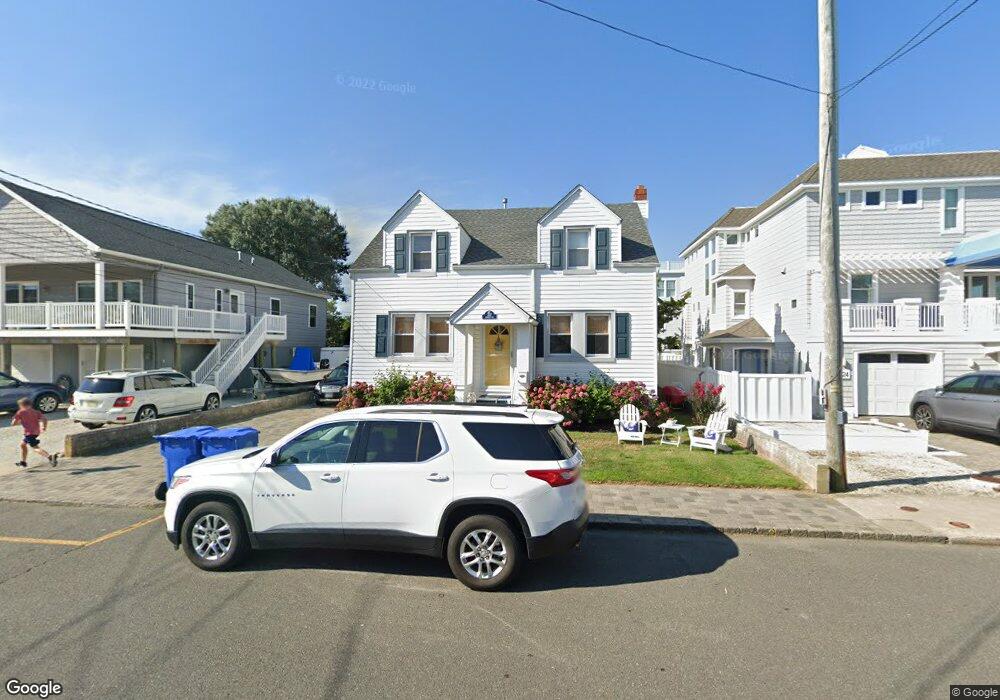
322 Berkeley Ave Unit U3 Beach Haven, NJ 08008
Long Beach Island NeighborhoodEstimated Value: $709,063 - $838,000
2
Beds
1
Bath
731
Sq Ft
$1,023/Sq Ft
Est. Value
About This Home
This home is located at 322 Berkeley Ave Unit U3, Beach Haven, NJ 08008 and is currently estimated at $747,766, approximately $1,022 per square foot. 322 Berkeley Ave Unit U3 is a home located in Ocean County with nearby schools including Beach Haven School, Southern Regional Middle School, and Southern Regional High School.
Ownership History
Date
Name
Owned For
Owner Type
Purchase Details
Closed on
Sep 4, 2020
Sold by
Midland Ira Inc and Gerald Rosenblum Ira 14-63624 Tr
Bought by
Sullivan David and Sullivan Gina
Current Estimated Value
Home Financials for this Owner
Home Financials are based on the most recent Mortgage that was taken out on this home.
Original Mortgage
$419,920
Outstanding Balance
$368,394
Interest Rate
2.9%
Mortgage Type
New Conventional
Estimated Equity
$379,372
Purchase Details
Closed on
May 31, 2011
Sold by
Grose Hugh J and Grose Susan M
Bought by
Entrust Freedom Llc and Gerald Rosenblum Ira #14-63624 Tr
Purchase Details
Closed on
Mar 24, 2007
Sold by
Thron Rajinder and Fitzgerald Rose
Bought by
Grose Hugh J and Grose Susan M
Home Financials for this Owner
Home Financials are based on the most recent Mortgage that was taken out on this home.
Original Mortgage
$238,320
Interest Rate
6.19%
Mortgage Type
Purchase Money Mortgage
Create a Home Valuation Report for This Property
The Home Valuation Report is an in-depth analysis detailing your home's value as well as a comparison with similar homes in the area
Home Values in the Area
Average Home Value in this Area
Purchase History
| Date | Buyer | Sale Price | Title Company |
|---|---|---|---|
| Sullivan David | $524,900 | Titlemark | |
| Sullivan David | $524,900 | Titlemark | |
| Entrust Freedom Llc | $305,000 | First American Title Ins Co | |
| Grose Hugh J | $297,900 | Surety Title Corporation |
Source: Public Records
Mortgage History
| Date | Status | Borrower | Loan Amount |
|---|---|---|---|
| Open | Sullivan David | $419,920 | |
| Closed | Sullivan David | $419,920 | |
| Previous Owner | Grose Hugh J | $238,320 |
Source: Public Records
Tax History
| Year | Tax Paid | Tax Assessment Tax Assessment Total Assessment is a certain percentage of the fair market value that is determined by local assessors to be the total taxable value of land and additions on the property. | Land | Improvement |
|---|---|---|---|---|
| 2025 | $4,407 | $335,900 | $229,100 | $106,800 |
| 2024 | $4,068 | $335,900 | $229,100 | $106,800 |
| 2023 | $3,779 | $335,900 | $229,100 | $106,800 |
| 2022 | $3,779 | $335,900 | $229,100 | $106,800 |
| 2021 | $3,685 | $335,900 | $229,100 | $106,800 |
| 2020 | $3,313 | $295,500 | $229,100 | $66,400 |
| 2019 | $3,218 | $295,500 | $229,100 | $66,400 |
| 2018 | $3,330 | $295,500 | $229,100 | $66,400 |
| 2017 | $3,180 | $295,500 | $229,100 | $66,400 |
| 2016 | $2,603 | $196,300 | $145,200 | $51,100 |
| 2015 | $2,491 | $196,300 | $145,200 | $51,100 |
| 2014 | $2,356 | $196,300 | $145,200 | $51,100 |
Source: Public Records
Map
Nearby Homes
- 706 S Bay Ave
- 26 Ocean St
- 444 Engleside Ave Unit U2
- 315 Centre St Unit 5
- 424 Iroquois Ave
- 1610 S Bay Ave Unit 3
- 320 3rd St
- 409 3rd St
- 301 N Beach Ave
- 223 225 Stratford
- 205 Stratford Ave
- 225 E Fourth
- 225 4th St
- 415 N Bay Ave Unit 4
- 415 N Bay Ave Unit 1
- 415 N Bay Ave Unit 3
- 415 N Bay Ave Unit 2
- 106 5th St
- 601 N Del Ave Unit 12
- 23 5th St
- 322 Berkeley Ave Unit U2
- 322 Berkeley Ave Unit U1
- 322 Berkeley Ave Unit 1
- 322 Berkeley Ave Unit 3
- 322 Berkeley Ave Unit 2
- 320 Berkeley Ave
- 327 Norwood Ave
- 324 Berkeley Ave
- 323 Norwood Ave
- 318 Berkeley Ave
- 314 Berkeley Ave
- 315 Norwood Ave
- 333 Norwood Ave
- 310 Berkeley Ave
- 325 Berkeley Ave
- 319 Berkeley Ave
- 329 Berkeley Ave
- 311 Berkeley Ave
- 335 Berkeley Ave
Your Personal Tour Guide
Ask me questions while you tour the home.