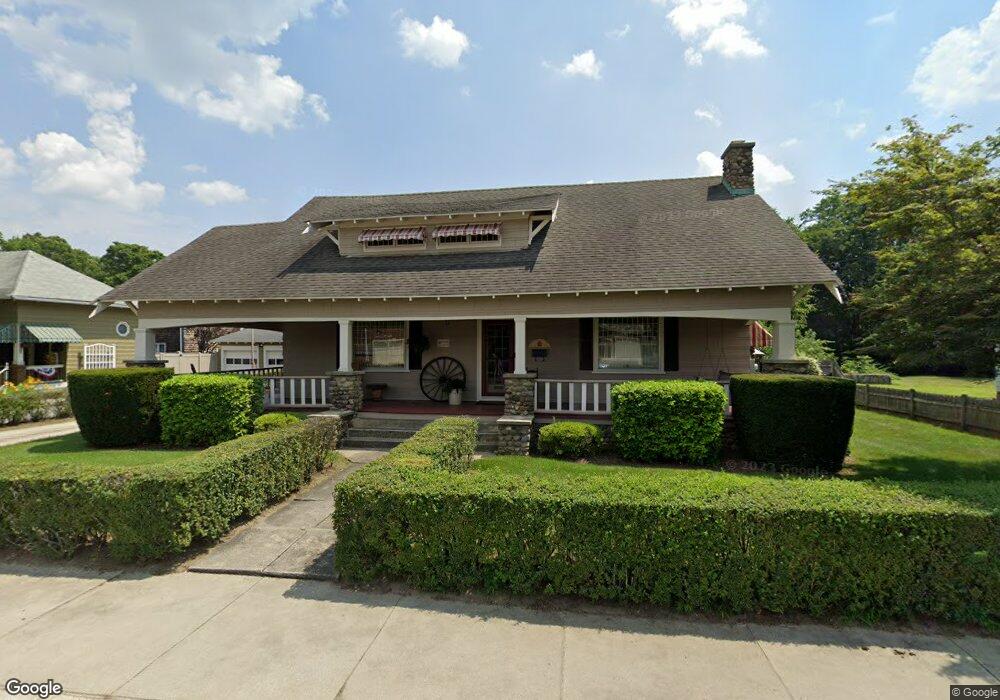
322 Coe St Woonsocket, RI 02895
Globe District NeighborhoodEstimated Value: $421,440 - $588,000
3
Beds
2
Baths
1,914
Sq Ft
$247/Sq Ft
Est. Value
About This Home
This home is located at 322 Coe St, Woonsocket, RI 02895 and is currently estimated at $472,860, approximately $247 per square foot. 322 Coe St is a home located in Providence County with nearby schools including Woonsocket High School, Founders Academy, and Beacon Charter School.
Ownership History
Date
Name
Owned For
Owner Type
Purchase Details
Closed on
Sep 27, 2016
Sold by
Plante Jeffrey M and Plante Susan A
Bought by
Plante Susan A
Current Estimated Value
Purchase Details
Closed on
Nov 17, 1999
Sold by
Alexander Helen M
Bought by
Plante Jeffrey M and Plante Susan A
Create a Home Valuation Report for This Property
The Home Valuation Report is an in-depth analysis detailing your home's value as well as a comparison with similar homes in the area
Home Values in the Area
Average Home Value in this Area
Purchase History
| Date | Buyer | Sale Price | Title Company |
|---|---|---|---|
| Plante Susan A | -- | -- | |
| Plante Jeffrey M | $150,000 | -- | |
| Plante Susan A | -- | -- | |
| Plante Jeffrey M | $150,000 | -- |
Source: Public Records
Mortgage History
| Date | Status | Borrower | Loan Amount |
|---|---|---|---|
| Previous Owner | Plante Jeffrey M | $115,500 | |
| Previous Owner | Plante Jeffrey M | $13,400 |
Source: Public Records
Tax History
| Year | Tax Paid | Tax Assessment Tax Assessment Total Assessment is a certain percentage of the fair market value that is determined by local assessors to be the total taxable value of land and additions on the property. | Land | Improvement |
|---|---|---|---|---|
| 2025 | $5,089 | $453,200 | $99,700 | $353,500 |
| 2024 | $4,781 | $328,800 | $94,700 | $234,100 |
| 2023 | $4,597 | $328,800 | $94,700 | $234,100 |
| 2022 | $4,597 | $328,800 | $94,700 | $234,100 |
| 2021 | $4,776 | $201,100 | $61,900 | $139,200 |
| 2020 | $4,826 | $201,100 | $61,900 | $139,200 |
| 2018 | $4,842 | $201,100 | $61,900 | $139,200 |
| 2017 | $5,385 | $178,900 | $55,600 | $123,300 |
| 2016 | $5,696 | $178,900 | $55,600 | $123,300 |
| 2015 | $6,544 | $178,900 | $55,600 | $123,300 |
| 2014 | $4,330 | $172,100 | $61,200 | $110,900 |
Source: Public Records
Map
Nearby Homes
- 84 Bernice Ave
- 190 Coe St
- 184 Avenue C Unit 2
- 184 Avenue C Unit 5
- 184 Avenue C Unit 6
- 184 Avenue C Unit 3
- 184 Avenue C Unit 4
- 184 Avenue C Unit 1
- 435 S Main St
- 43 Summit St
- 34 Smithfield Rd
- 65 Milton Ave
- 0 Holbrook Ln Unit 1402850
- 42 Transit St
- 83 4th Ave
- 0 Pound Hill Rd Unit 1403654
- 0 Pound Hill Rd Unit 1403653
- 1 Admiral St
- 123 4th Ave
- 120 East St
Your Personal Tour Guide
Ask me questions while you tour the home.