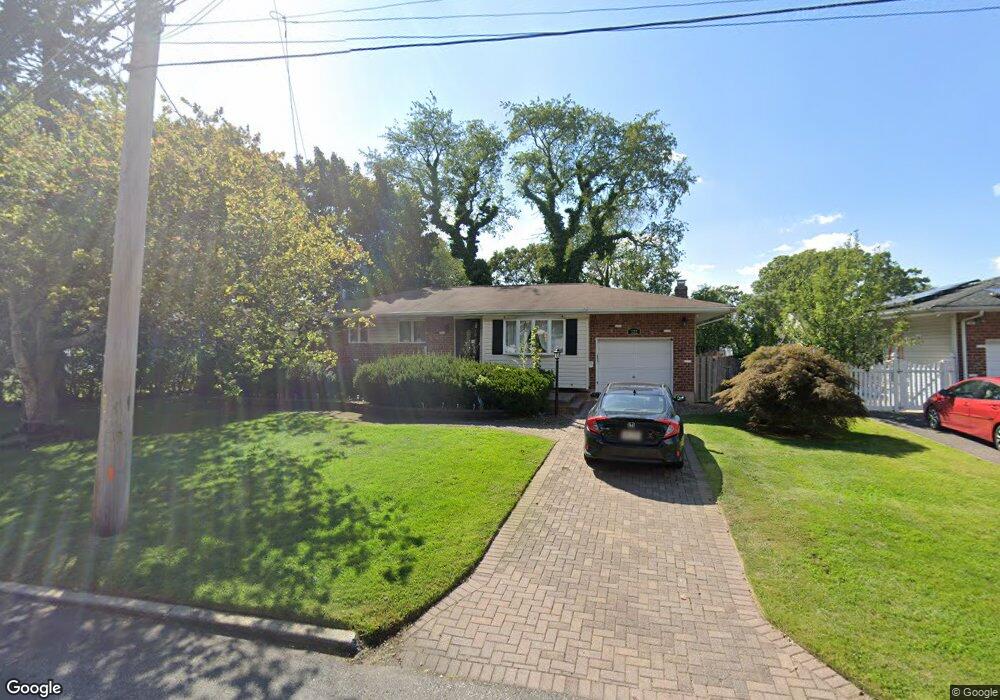
322 E 4th St Deer Park, NY 11729
Estimated Value: $565,000 - $667,000
3
Beds
2
Baths
1,211
Sq Ft
$520/Sq Ft
Est. Value
About This Home
This home is located at 322 E 4th St, Deer Park, NY 11729 and is currently estimated at $629,504, approximately $519 per square foot. 322 E 4th St is a home located in Suffolk County with nearby schools including Robert Frost Middle School and Deer Park High School.
Ownership History
Date
Name
Owned For
Owner Type
Purchase Details
Closed on
Jun 28, 2021
Sold by
Bartley Brian and Bartley Katherine
Bought by
Francillon Marie and Francillon Jean Louis
Current Estimated Value
Home Financials for this Owner
Home Financials are based on the most recent Mortgage that was taken out on this home.
Original Mortgage
$442,612
Outstanding Balance
$400,730
Interest Rate
2.9%
Mortgage Type
FHA
Estimated Equity
$228,774
Purchase Details
Closed on
May 1, 2009
Sold by
Collins Stacey Lee
Bought by
Bartley Brian
Home Financials for this Owner
Home Financials are based on the most recent Mortgage that was taken out on this home.
Original Mortgage
$273,946
Interest Rate
4.93%
Mortgage Type
Purchase Money Mortgage
Purchase Details
Closed on
Apr 24, 2007
Purchase Details
Closed on
Jul 23, 2001
Sold by
Weissman David L
Bought by
Weissman David L
Create a Home Valuation Report for This Property
The Home Valuation Report is an in-depth analysis detailing your home's value as well as a comparison with similar homes in the area
Home Values in the Area
Average Home Value in this Area
Purchase History
| Date | Buyer | Sale Price | Title Company |
|---|---|---|---|
| Francillon Marie | $455,000 | None Available | |
| Bartley Brian | $279,000 | Michael Ackerman | |
| Bartley Brian | $279,000 | Michael Ackerman | |
| -- | -- | -- | |
| -- | -- | -- | |
| Weissman David L | -- | -- | |
| Weissman David L | -- | -- |
Source: Public Records
Mortgage History
| Date | Status | Borrower | Loan Amount |
|---|---|---|---|
| Open | Francillon Marie | $442,612 | |
| Previous Owner | Bartley Brian | $273,946 |
Source: Public Records
Tax History
| Year | Tax Paid | Tax Assessment Tax Assessment Total Assessment is a certain percentage of the fair market value that is determined by local assessors to be the total taxable value of land and additions on the property. | Land | Improvement |
|---|---|---|---|---|
| 2024 | $11,961 | $3,500 | $390 | $3,110 |
| 2023 | $11,961 | $3,500 | $390 | $3,110 |
| 2022 | $9,071 | $3,500 | $390 | $3,110 |
| 2021 | $9,071 | $3,500 | $390 | $3,110 |
| 2020 | $9,846 | $3,500 | $390 | $3,110 |
| 2019 | $9,846 | $0 | $0 | $0 |
| 2018 | $9,227 | $3,500 | $390 | $3,110 |
| 2017 | $9,227 | $3,500 | $390 | $3,110 |
| 2016 | $9,172 | $3,500 | $390 | $3,110 |
| 2015 | -- | $3,500 | $390 | $3,110 |
| 2014 | -- | $3,800 | $390 | $3,410 |
Source: Public Records
Map
Nearby Homes
Your Personal Tour Guide
Ask me questions while you tour the home.