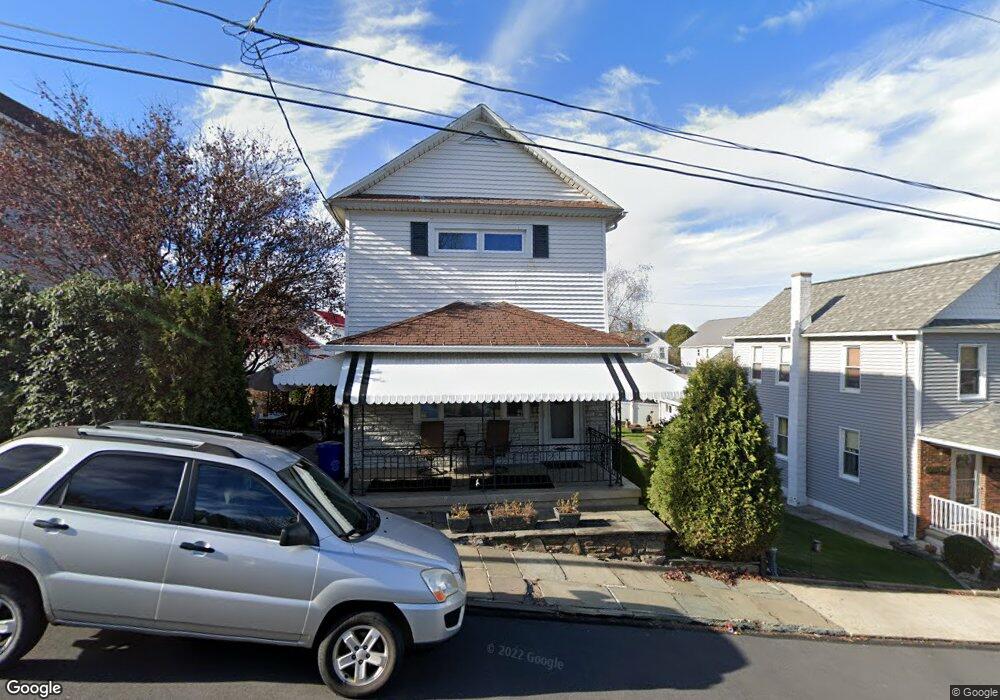
322 Front St Dupont, PA 18641
Estimated Value: $141,000 - $164,000
2
Beds
1
Bath
986
Sq Ft
$154/Sq Ft
Est. Value
About This Home
This home is located at 322 Front St, Dupont, PA 18641 and is currently estimated at $152,152, approximately $154 per square foot. 322 Front St is a home located in Luzerne County with nearby schools including Pittston City Intermediate Center, Pittston Area Middle School, and Pittston Area Senior High School.
Ownership History
Date
Name
Owned For
Owner Type
Purchase Details
Closed on
Oct 17, 2017
Sold by
Holley Sylvia A and Holley Andre B
Bought by
Hughes Colleen and Gratter Anthony R
Current Estimated Value
Home Financials for this Owner
Home Financials are based on the most recent Mortgage that was taken out on this home.
Original Mortgage
$75,605
Outstanding Balance
$63,866
Interest Rate
4.25%
Mortgage Type
FHA
Estimated Equity
$88,286
Purchase Details
Closed on
Mar 30, 2017
Sold by
Lello Elizabeth and Lello Elizabeth Ann
Bought by
Holly Sylvia A
Purchase Details
Closed on
Jan 1, 1960
Bought by
Lello Elizabeth
Create a Home Valuation Report for This Property
The Home Valuation Report is an in-depth analysis detailing your home's value as well as a comparison with similar homes in the area
Home Values in the Area
Average Home Value in this Area
Purchase History
| Date | Buyer | Sale Price | Title Company |
|---|---|---|---|
| Hughes Colleen | $77,000 | None Available | |
| Holly Sylvia A | -- | None Available | |
| Lello Elizabeth | -- | -- |
Source: Public Records
Mortgage History
| Date | Status | Borrower | Loan Amount |
|---|---|---|---|
| Open | Hughes Colleen | $75,605 |
Source: Public Records
Tax History Compared to Growth
Tax History
| Year | Tax Paid | Tax Assessment Tax Assessment Total Assessment is a certain percentage of the fair market value that is determined by local assessors to be the total taxable value of land and additions on the property. | Land | Improvement |
|---|---|---|---|---|
| 2025 | $1,480 | $60,100 | $21,600 | $38,500 |
| 2024 | $1,480 | $60,100 | $21,600 | $38,500 |
| 2023 | $1,480 | $60,100 | $21,600 | $38,500 |
| 2022 | $1,469 | $60,100 | $21,600 | $38,500 |
| 2021 | $1,469 | $60,100 | $21,600 | $38,500 |
| 2020 | $1,435 | $60,100 | $21,600 | $38,500 |
| 2019 | $1,423 | $60,100 | $21,600 | $38,500 |
| 2018 | $1,394 | $60,100 | $21,600 | $38,500 |
| 2017 | $1,333 | $60,100 | $21,600 | $38,500 |
| 2016 | -- | $60,100 | $21,600 | $38,500 |
| 2015 | $1,018 | $60,100 | $21,600 | $38,500 |
| 2014 | $1,018 | $60,100 | $21,600 | $38,500 |
Source: Public Records
Map
Nearby Homes