Estimated Value: $402,514 - $415,000
3
Beds
2
Baths
2,190
Sq Ft
$187/Sq Ft
Est. Value
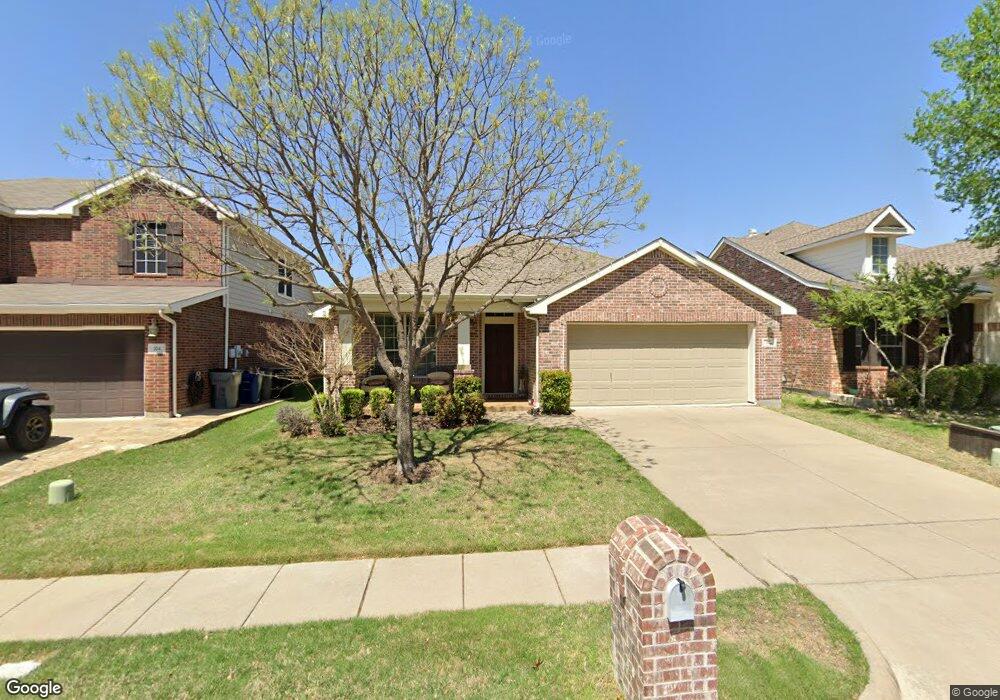
About This Home
This home is located at 322 Highland Meadows Dr, Wylie, TX 75098 and is currently estimated at $409,129, approximately $186 per square foot. 322 Highland Meadows Dr is a home located in Collin County with nearby schools including Cheri Cox Elementary School, AB Harrison Intermediate School, and Grady Burnett J High School.
Ownership History
Date
Name
Owned For
Owner Type
Purchase Details
Closed on
Jul 25, 2017
Sold by
Drain William A
Bought by
Drain William A
Current Estimated Value
Home Financials for this Owner
Home Financials are based on the most recent Mortgage that was taken out on this home.
Original Mortgage
$166,824
Outstanding Balance
$120,517
Interest Rate
3.91%
Mortgage Type
New Conventional
Estimated Equity
$288,612
Purchase Details
Closed on
Dec 7, 2007
Sold by
Weekley Homes Lp
Bought by
Drain William A
Home Financials for this Owner
Home Financials are based on the most recent Mortgage that was taken out on this home.
Original Mortgage
$185,095
Interest Rate
6.4%
Purchase Details
Closed on
Mar 8, 2007
Sold by
Woodbridge Ix Ltd
Bought by
Weekley Homes Lp
Create a Home Valuation Report for This Property
The Home Valuation Report is an in-depth analysis detailing your home's value as well as a comparison with similar homes in the area
Home Values in the Area
Average Home Value in this Area
Purchase History
| Date | Buyer | Sale Price | Title Company |
|---|---|---|---|
| Drain William A | -- | None Available | |
| Drain William A | -- | Ptc | |
| Weekley Homes Lp | -- | Ptc |
Source: Public Records
Mortgage History
| Date | Status | Borrower | Loan Amount |
|---|---|---|---|
| Open | Drain William A | $166,824 | |
| Previous Owner | Drain William A | $185,095 |
Source: Public Records
Tax History Compared to Growth
Tax History
| Year | Tax Paid | Tax Assessment Tax Assessment Total Assessment is a certain percentage of the fair market value that is determined by local assessors to be the total taxable value of land and additions on the property. | Land | Improvement |
|---|---|---|---|---|
| 2025 | $6,157 | $403,821 | $110,000 | $293,821 |
| 2024 | $6,157 | $378,076 | $110,000 | $312,364 |
| 2023 | $6,157 | $343,705 | $90,000 | $314,049 |
| 2022 | $6,855 | $312,459 | $90,000 | $281,693 |
| 2021 | $6,683 | $284,054 | $60,000 | $224,054 |
| 2020 | $6,642 | $267,488 | $60,000 | $207,488 |
| 2019 | $7,130 | $271,338 | $60,000 | $211,338 |
| 2018 | $6,931 | $257,372 | $60,000 | $197,372 |
| 2017 | $6,337 | $247,341 | $55,000 | $192,341 |
| 2016 | $5,944 | $220,999 | $44,000 | $176,999 |
| 2015 | $4,746 | $205,277 | $44,000 | $161,277 |
Source: Public Records
Map
Nearby Homes
- 319 Highland View Dr
- 301 Highland Park Ln
- 123 Monarch Way
- 2014 Fairway Woods Dr
- 1905 Fairway Crossing Rd
- 412 Highland Ridge Dr
- 303 Parke Lake Dr
- 308 Parke Hollow Dr
- 100 Lavender Ln
- 217 Champion
- 206 Covington Dr
- 212 Colonial Dr
- 102 Autumn Sage Dr
- 107 Lantana Ln
- 322 Hogue Ln
- 528 Highland Ridge Dr
- 1706 Asbury Dr
- 103 Cascade Ln
- 506 Hemlock Ct
- Shepherd Plan at Dominion of Pleasant Valley - 70' Homesites
- 320 Highland Meadows Dr
- 324 Highland Meadows Dr
- 326 Highland Meadows Dr
- 318 Highland Meadows Dr
- 323 Fairland Dr
- 321 Fairland Dr
- 325 Fairland Dr
- 2001 Lake Highlands Dr
- 316 Highland Meadows Dr
- 319 Fairland Dr
- 327 Fairland Dr
- 317 Fairland Dr
- 2000 Lake Highlands Dr
- 329 Fairland Dr
- 315 Highland Meadows Dr
- 314 Highland Meadows Dr
- 2003 Lake Highlands Dr
- 315 Fairland Dr
- 313 Highland Meadows Dr
- 2002 Lake Highlands Dr