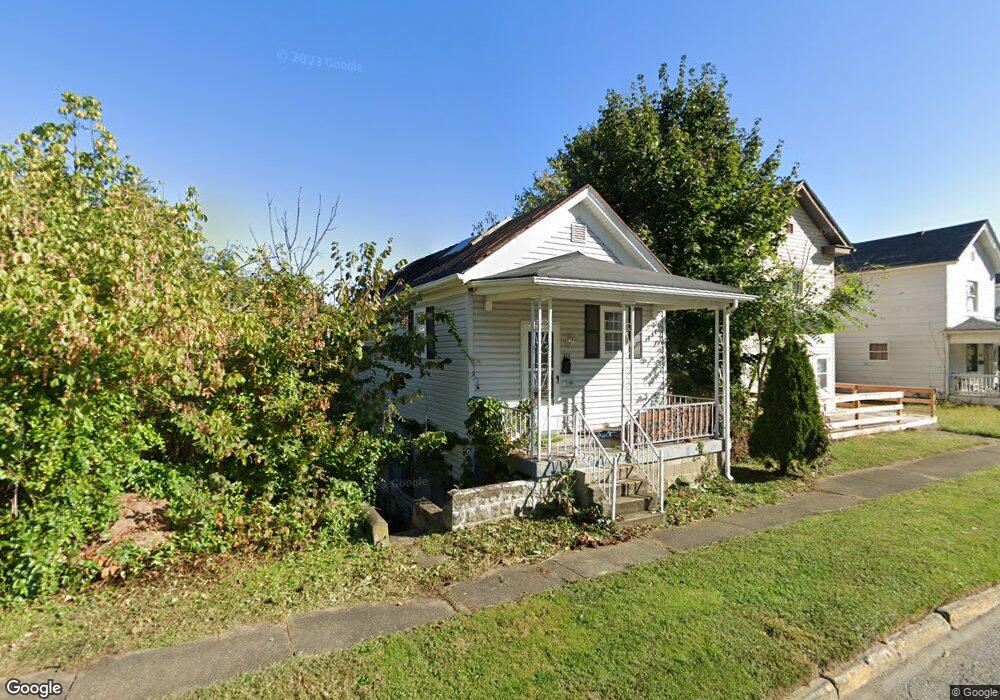
322 Jacquette St Bridgeport, OH 43912
Estimated Value: $52,000 - $80,000
1
Bed
1
Bath
512
Sq Ft
$127/Sq Ft
Est. Value
About This Home
This home is located at 322 Jacquette St, Bridgeport, OH 43912 and is currently estimated at $65,221, approximately $127 per square foot. 322 Jacquette St is a home located in Belmont County with nearby schools including Bridgeport Elementary School, Bridgeport Middle School, and Bridgeport High School.
Ownership History
Date
Name
Owned For
Owner Type
Purchase Details
Closed on
Oct 10, 2018
Sold by
Nolan Kevin C and Nolan Tina M
Bought by
Nolan Jerry Edward
Current Estimated Value
Purchase Details
Closed on
Dec 7, 2015
Sold by
County Of Belmont
Bought by
Nolan Kevin
Purchase Details
Closed on
Sep 4, 2001
Sold by
Capobianco Albert
Bought by
Capobianco Albert
Purchase Details
Closed on
Mar 13, 2000
Sold by
Littleton Tamra Charlene
Bought by
Littleton Tamra Charlene
Purchase Details
Closed on
Aug 11, 1997
Sold by
Mccormick Ricky J
Bought by
Mccormick Ricky J
Purchase Details
Closed on
Apr 24, 1996
Sold by
Mccormick Gina Ann
Bought by
Mccormick Gina Ann
Purchase Details
Closed on
Nov 5, 1991
Sold by
Crozier Vane L
Bought by
Crozier Vane L
Purchase Details
Closed on
Jan 1, 1986
Sold by
Hagiloizou Christine
Bought by
Hagiloizou Christine
Create a Home Valuation Report for This Property
The Home Valuation Report is an in-depth analysis detailing your home's value as well as a comparison with similar homes in the area
Home Values in the Area
Average Home Value in this Area
Purchase History
| Date | Buyer | Sale Price | Title Company |
|---|---|---|---|
| Nolan Jerry Edward | -- | None Available | |
| Nolan Kevin | -- | None Available | |
| Capobianco Albert | $15,000 | -- | |
| Littleton Tamra Charlene | $15,000 | -- | |
| Mccormick Ricky J | -- | -- | |
| Mccormick Gina Ann | $14,500 | -- | |
| Crozier Vane L | $5,000 | -- | |
| Hagiloizou Christine | -- | -- |
Source: Public Records
Tax History Compared to Growth
Tax History
| Year | Tax Paid | Tax Assessment Tax Assessment Total Assessment is a certain percentage of the fair market value that is determined by local assessors to be the total taxable value of land and additions on the property. | Land | Improvement |
|---|---|---|---|---|
| 2024 | $548 | $13,190 | $1,810 | $11,380 |
| 2023 | $480 | $10,280 | $1,820 | $8,460 |
| 2022 | $456 | $10,286 | $1,823 | $8,463 |
| 2021 | $454 | $10,286 | $1,823 | $8,463 |
| 2020 | $372 | $8,570 | $1,520 | $7,050 |
| 2019 | $393 | $8,570 | $1,520 | $7,050 |
| 2018 | $1,437 | $8,570 | $1,520 | $7,050 |
| 2017 | $385 | $8,010 | $1,540 | $6,470 |
| 2016 | $712 | $8,010 | $1,540 | $6,470 |
| 2015 | $398 | $8,010 | $1,540 | $6,470 |
| 2014 | $406 | $7,870 | $1,400 | $6,470 |
| 2013 | $404 | $7,870 | $1,400 | $6,470 |
Source: Public Records
Map
Nearby Homes
- 8 Spring St
- 67730 Kirkwood Heights Rd
- 116 Ohio St
- 61 Laipple St
- 1049 Buckeye St
- 67620 Kirkwood Heights Rd
- 67605 Kirkwood Heights Rd
- 219 S York St
- 0 Ohio 7
- 67478 Kirkwood Heights Rd
- 217 N Huron St
- 50 Kentucky St
- 301 N Huron St
- 866 Main St
- 513 S Penn St
- 25 Kentucky St
- 3 S Front St
- 98 Iowa St
- 20 Locust Ave
- 451 N Wabash St
- 405 Dekalb St
- 407 Dekalb St
- 320 Jacquette St
- 403 Dekalb St
- 316 Jacquette St
- 501 Dekalb St
- 323 Jacquette St
- 401 Dekalb St
- 321 Jacquette St
- 325 Whitely St
- 503 Dekalb St
- 314 Jacquette St
- 321 Whitely St
- 400 Dekalb St
- 329 Whitely St
- 317 Whitely St
- 319 Jacquette St
- 313 Jacquette St
- 315 Whitely St
- 310 Jacquette St