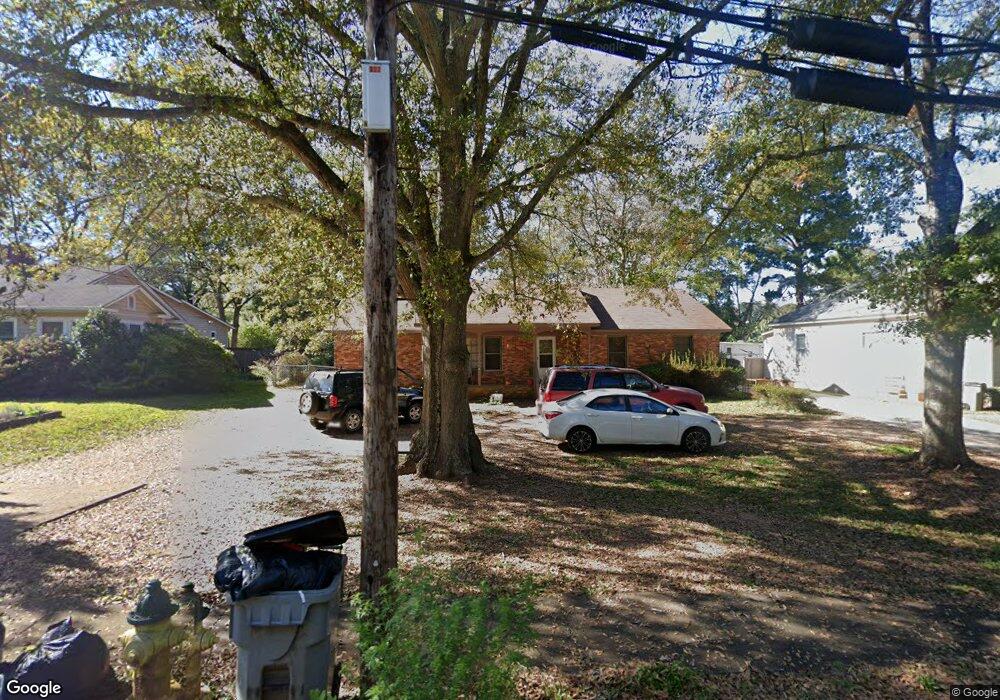
322 Jefferson St Lagrange, GA 30240
Estimated Value: $93,000 - $211,859
3
Beds
2
Baths
1,696
Sq Ft
$85/Sq Ft
Est. Value
About This Home
This home is located at 322 Jefferson St, Lagrange, GA 30240 and is currently estimated at $143,965, approximately $84 per square foot. 322 Jefferson St is a home located in Troup County with nearby schools including Ethel W. Kight Elementary School, Hollis Hand Elementary School, and Franklin Forest Elementary School.
Ownership History
Date
Name
Owned For
Owner Type
Purchase Details
Closed on
Dec 3, 2024
Sold by
Heard Raymond H
Bought by
Hutchinson Investments Llc
Current Estimated Value
Purchase Details
Closed on
Jul 3, 1995
Sold by
Lesia Johnson
Bought by
Heard Raymond H and Heard Jessie L
Purchase Details
Closed on
Jun 28, 1995
Sold by
Rodney Johnson
Bought by
Lesia Johnson
Purchase Details
Closed on
May 30, 1990
Sold by
Linda D Kaylor
Bought by
Rodney Johnson
Purchase Details
Closed on
Oct 24, 1988
Sold by
Carter Kenneth L and Carter Rebecca M
Bought by
Linda D Kaylor
Purchase Details
Closed on
Nov 1, 1982
Sold by
Julian Clyde Carter
Bought by
Carter Kenneth L and Carter Rebecca M
Purchase Details
Closed on
Jan 1, 1972
Sold by
Caris Erquitt
Bought by
Julian Clyde Carter
Purchase Details
Closed on
Jan 1, 1965
Sold by
White J T
Bought by
Caris Erquitt
Create a Home Valuation Report for This Property
The Home Valuation Report is an in-depth analysis detailing your home's value as well as a comparison with similar homes in the area
Home Values in the Area
Average Home Value in this Area
Purchase History
| Date | Buyer | Sale Price | Title Company |
|---|---|---|---|
| Hutchinson Investments Llc | $92,500 | -- | |
| Heard Raymond H | $65,000 | -- | |
| Lesia Johnson | -- | -- | |
| Rodney Johnson | -- | -- | |
| Linda D Kaylor | $52,500 | -- | |
| Carter Kenneth L | -- | -- | |
| Julian Clyde Carter | $27,500 | -- | |
| Caris Erquitt | -- | -- |
Source: Public Records
Tax History Compared to Growth
Tax History
| Year | Tax Paid | Tax Assessment Tax Assessment Total Assessment is a certain percentage of the fair market value that is determined by local assessors to be the total taxable value of land and additions on the property. | Land | Improvement |
|---|---|---|---|---|
| 2024 | -- | $53,400 | $5,040 | $48,360 |
| 2023 | $0 | $47,560 | $5,040 | $42,520 |
| 2022 | $1,244 | $44,560 | $5,040 | $39,520 |
| 2021 | $1,077 | $35,720 | $5,040 | $30,680 |
| 2020 | $1,077 | $35,720 | $5,040 | $30,680 |
| 2019 | $989 | $32,800 | $5,040 | $27,760 |
| 2018 | $0 | $31,380 | $4,500 | $26,880 |
| 2017 | $946 | $31,380 | $4,500 | $26,880 |
| 2016 | $0 | $30,474 | $4,500 | $25,974 |
| 2015 | -- | $31,046 | $5,073 | $25,974 |
| 2014 | -- | $29,680 | $5,073 | $24,607 |
| 2013 | -- | $31,478 | $4,996 | $26,482 |
Source: Public Records
Map
Nearby Homes