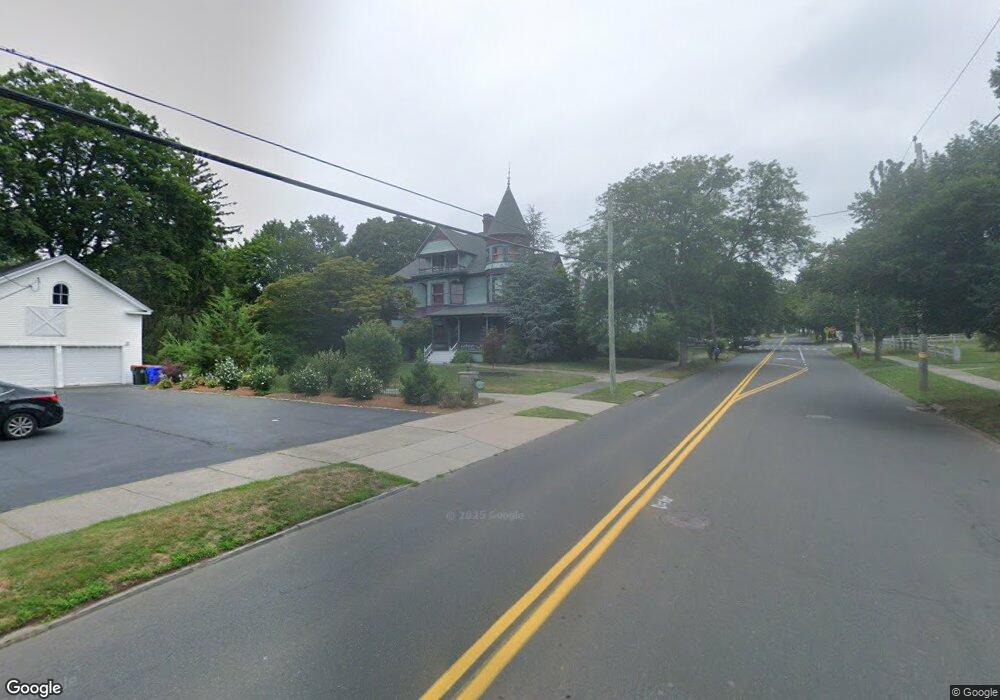
322 N Main St Wallingford, CT 06492
Estimated Value: $516,000 - $905,000
4
Beds
3
Baths
4,434
Sq Ft
$166/Sq Ft
Est. Value
About This Home
This home is located at 322 N Main St, Wallingford, CT 06492 and is currently estimated at $737,738, approximately $166 per square foot. 322 N Main St is a home with nearby schools including Moses Y Beach Elementary School, Rock Hill Elementary School, and Dag Hammarskjold Middle School.
Ownership History
Date
Name
Owned For
Owner Type
Purchase Details
Closed on
Feb 17, 2005
Sold by
Yancoskie Steven
Bought by
Dunlap William V
Current Estimated Value
Purchase Details
Closed on
Jul 8, 1996
Sold by
Agricultural Center
Bought by
Sinclair David N
Create a Home Valuation Report for This Property
The Home Valuation Report is an in-depth analysis detailing your home's value as well as a comparison with similar homes in the area
Home Values in the Area
Average Home Value in this Area
Purchase History
| Date | Buyer | Sale Price | Title Company |
|---|---|---|---|
| Dunlap William V | $480,000 | -- | |
| Dunlap William V | $480,000 | -- | |
| Sinclair David N | $210,000 | -- | |
| Sinclair David N | $210,000 | -- |
Source: Public Records
Mortgage History
| Date | Status | Borrower | Loan Amount |
|---|---|---|---|
| Open | Sinclair David N | $412,000 | |
| Closed | Sinclair David N | $343,500 | |
| Closed | Sinclair David N | $120,000 |
Source: Public Records
Tax History Compared to Growth
Tax History
| Year | Tax Paid | Tax Assessment Tax Assessment Total Assessment is a certain percentage of the fair market value that is determined by local assessors to be the total taxable value of land and additions on the property. | Land | Improvement |
|---|---|---|---|---|
| 2025 | $13,524 | $560,700 | $106,400 | $454,300 |
| 2024 | $12,046 | $392,900 | $93,900 | $299,000 |
| 2023 | $11,528 | $392,900 | $93,900 | $299,000 |
| 2022 | $11,410 | $392,900 | $93,900 | $299,000 |
| 2021 | $11,206 | $392,900 | $93,900 | $299,000 |
| 2020 | $11,051 | $378,600 | $103,000 | $275,600 |
| 2019 | $11,051 | $378,600 | $103,000 | $275,600 |
| 2018 | $10,843 | $378,600 | $103,000 | $275,600 |
| 2017 | $10,809 | $378,600 | $103,000 | $275,600 |
| 2016 | $10,559 | $378,600 | $103,000 | $275,600 |
| 2015 | $10,299 | $374,900 | $103,000 | $271,900 |
| 2014 | $9,151 | $340,300 | $103,000 | $237,300 |
Source: Public Records
Map
Nearby Homes
- 29 Curtis Ave
- 49 High St
- 43 Academy St
- 85 N Colony St
- 530 Center St Unit C1
- 39 Hoffman Ct Unit B3
- 67 Spring St
- 6 Kovacs Place
- 40 Lake St
- 148 Judd Square Unit 148
- 4 Sunset Dr
- 212 S Orchard St
- 210 S Elm St
- 15 Marshall St
- 26 West St
- 11 Westview Dr
- 91 Marshall St
- 1 Pine Glen Terrace
- 109 Clifton St
- 30 Clinton Place
- 326 N Main St
- 330 N Main St
- 147 Christian St
- 300 N Main St
- 310 N Main St
- 311 N Main St
- 143 Christian St
- 139 Christian St
- 135 Christian St
- 301 N Main St
- 288 N Main St
- 280 N Main St
- 355 N Main St
- 171 N Whittlesey Ave
- 177 N Whittlesey Ave
- 165 N Whittlesey Ave
- 163 N Whittlesey Ave
- 181 N Whittlesey Ave
- 157 N Whittlesey Ave
- 273 N Main St