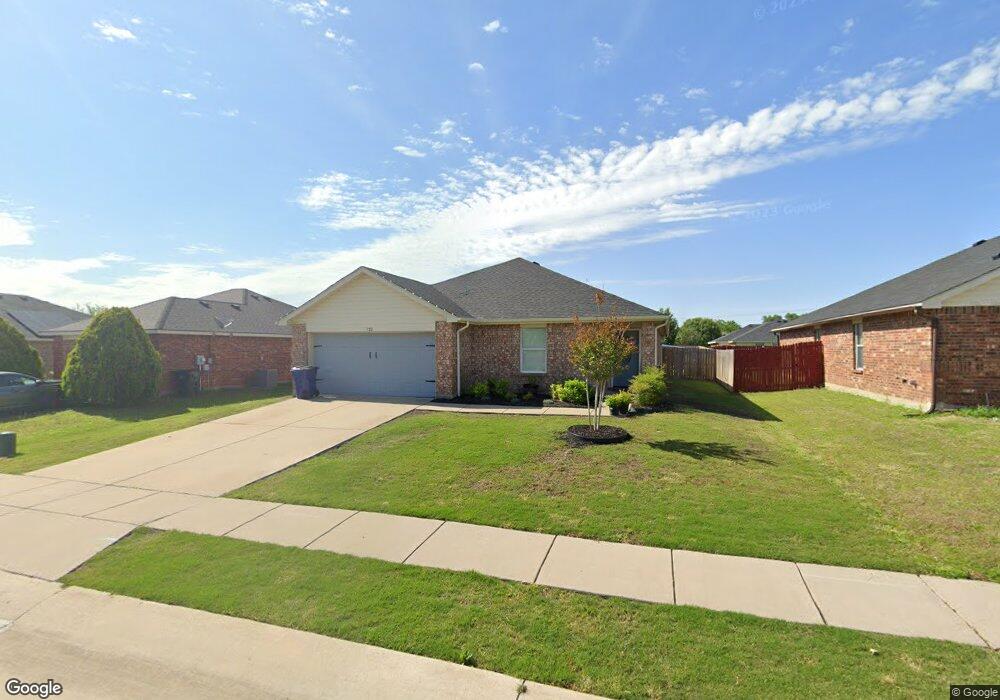
322 Quail Crossing Dr Sanger, TX 76266
Estimated Value: $275,706 - $291,000
3
Beds
2
Baths
1,608
Sq Ft
$178/Sq Ft
Est. Value
About This Home
This home is located at 322 Quail Crossing Dr, Sanger, TX 76266 and is currently estimated at $285,677, approximately $177 per square foot. 322 Quail Crossing Dr is a home located in Denton County with nearby schools including Chisholm Trail Elementary School, Clear Creek Intermediate School, and Sanger Sixth Grade Campus.
Ownership History
Date
Name
Owned For
Owner Type
Purchase Details
Closed on
Jul 24, 2018
Sold by
Clanton Jermey
Bought by
Beall Dalton Chase and Beall Jordan Janelle
Current Estimated Value
Home Financials for this Owner
Home Financials are based on the most recent Mortgage that was taken out on this home.
Original Mortgage
$191,468
Outstanding Balance
$164,508
Interest Rate
4.12%
Mortgage Type
FHA
Estimated Equity
$121,169
Purchase Details
Closed on
Apr 21, 2015
Sold by
Worster Chris and Worster Jennifer
Bought by
Clanton Jermey
Home Financials for this Owner
Home Financials are based on the most recent Mortgage that was taken out on this home.
Original Mortgage
$137,902
Interest Rate
3.89%
Mortgage Type
VA
Purchase Details
Closed on
Feb 25, 2004
Sold by
Nuhome Of Texas
Bought by
Worster Chris
Home Financials for this Owner
Home Financials are based on the most recent Mortgage that was taken out on this home.
Original Mortgage
$103,162
Interest Rate
5.65%
Mortgage Type
FHA
Create a Home Valuation Report for This Property
The Home Valuation Report is an in-depth analysis detailing your home's value as well as a comparison with similar homes in the area
Home Values in the Area
Average Home Value in this Area
Purchase History
| Date | Buyer | Sale Price | Title Company |
|---|---|---|---|
| Beall Dalton Chase | -- | None Available | |
| Clanton Jermey | -- | None Available | |
| Worster Chris | -- | -- |
Source: Public Records
Mortgage History
| Date | Status | Borrower | Loan Amount |
|---|---|---|---|
| Open | Beall Dalton Chase | $191,468 | |
| Previous Owner | Clanton Jermey | $137,902 | |
| Previous Owner | Worster Chris | $103,162 |
Source: Public Records
Tax History Compared to Growth
Tax History
| Year | Tax Paid | Tax Assessment Tax Assessment Total Assessment is a certain percentage of the fair market value that is determined by local assessors to be the total taxable value of land and additions on the property. | Land | Improvement |
|---|---|---|---|---|
| 2025 | $4,254 | $290,152 | $73,425 | $216,727 |
| 2024 | $5,407 | $267,543 | $0 | $0 |
| 2023 | $3,772 | $243,221 | $60,075 | $233,648 |
| 2022 | $4,903 | $221,110 | $60,075 | $171,255 |
| 2021 | $4,225 | $201,009 | $48,394 | $152,615 |
| 2020 | $4,150 | $187,555 | $40,784 | $146,771 |
| 2019 | $4,254 | $186,849 | $40,784 | $146,065 |
| 2018 | $4,000 | $174,733 | $40,784 | $133,949 |
| 2017 | $3,737 | $162,497 | $40,784 | $121,713 |
| 2016 | $3,720 | $154,507 | $40,784 | $113,723 |
| 2015 | $2,589 | $128,753 | $26,819 | $101,934 |
| 2014 | $2,589 | $120,287 | $26,819 | $93,468 |
| 2013 | -- | $109,456 | $26,819 | $84,214 |
Source: Public Records
Map
Nearby Homes
- 321 Quail Crossing Dr
- 319 Quail Crossing Dr
- 130 Southside Dr
- 202 Southland Dr
- 2004 S Stemmons St
- 2000 S Stemmons St
- 209 Southland Dr
- 226 Hillcrest St
- 117 Teal Rd
- 114 Pintail Ln
- 124 Morning Glory
- 212 Diane Dr
- 108 Magnolia Dr
- 942 First St
- 936 First St
- 185 Aster Dr
- 113 Diane Dr
- 109 Colonial Heights
- 0000 Rector Rd
- 505 Houston St
- 320 Quail Crossing Dr
- 324 Quail Crossing Dr
- 318 Quail Crossing Dr
- 326 Quail Crossing Dr
- 321 Deer Run Dr
- 325 Deer Run Dr
- 328 Quail Crossing Dr
- 319 Deer Run Dr
- 316 Quail Crossing Dr
- 327 Deer Run Dr
- 323 Quail Crossing Dr
- 325 Quail Crossing Dr
- 317 Deer Run Dr
- 329 Deer Run Dr
- 330 Quail Crossing Dr
- 314 Quail Crossing Dr
- 329 Quail Crossing Dr
- 317 Quail Crossing Dr
- 315 Deer Run Dr
- 331 Deer Run Dr