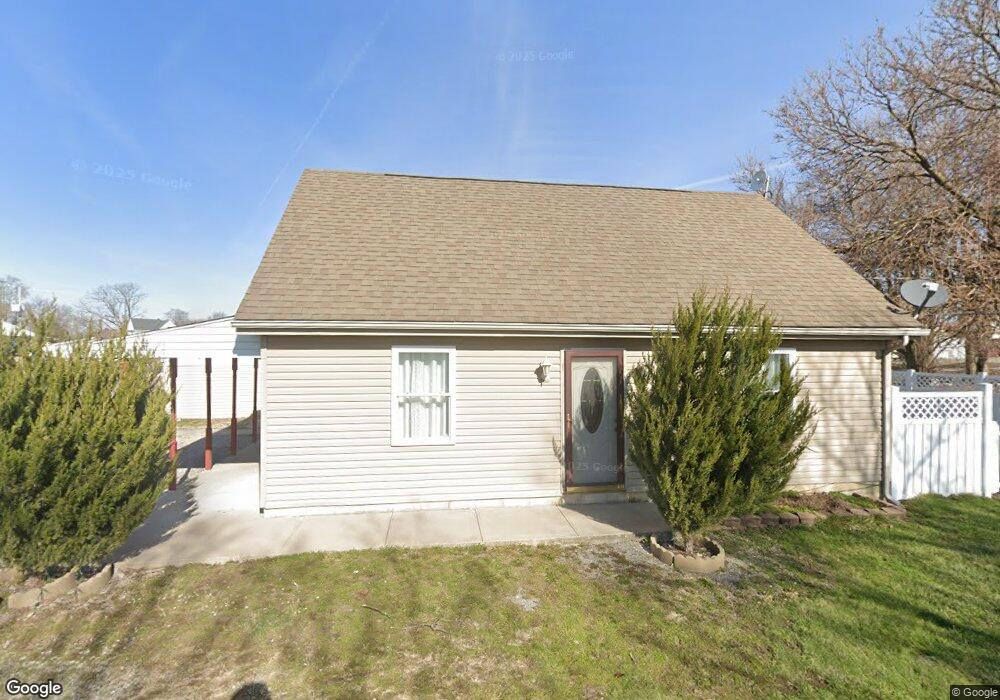
322 S Main Cross St Leipsic, OH 45856
Estimated Value: $81,000 - $120,000
3
Beds
2
Baths
1,116
Sq Ft
$93/Sq Ft
Est. Value
About This Home
This home is located at 322 S Main Cross St, Leipsic, OH 45856 and is currently estimated at $104,245, approximately $93 per square foot. 322 S Main Cross St is a home located in Putnam County with nearby schools including Leipsic Elementary School, Leipsic High School, and St. Mary's Catholic School.
Ownership History
Date
Name
Owned For
Owner Type
Purchase Details
Closed on
Sep 14, 2016
Sold by
Pester Chad E
Bought by
Noriega Mayra J and Nieto Jose De Jesus Enriquez
Current Estimated Value
Home Financials for this Owner
Home Financials are based on the most recent Mortgage that was taken out on this home.
Original Mortgage
$33,600
Outstanding Balance
$26,546
Interest Rate
3.43%
Mortgage Type
Closed End Mortgage
Estimated Equity
$77,699
Purchase Details
Closed on
Sep 13, 2010
Sold by
Wobler Anthony J and Pester Marilyn D
Bought by
Pester Chad E
Home Financials for this Owner
Home Financials are based on the most recent Mortgage that was taken out on this home.
Original Mortgage
$54,000
Interest Rate
4.54%
Mortgage Type
New Conventional
Purchase Details
Closed on
Feb 10, 2006
Sold by
Flores Francis
Bought by
Wobler Anthony J and Pester Marilyn P
Create a Home Valuation Report for This Property
The Home Valuation Report is an in-depth analysis detailing your home's value as well as a comparison with similar homes in the area
Purchase History
| Date | Buyer | Sale Price | Title Company |
|---|---|---|---|
| Noriega Mayra J | $42,000 | Attorney | |
| Pester Chad E | $60,000 | None Available | |
| Wobler Anthony J | $2,000 | None Available |
Source: Public Records
Mortgage History
| Date | Status | Borrower | Loan Amount |
|---|---|---|---|
| Open | Noriega Mayra J | $33,600 | |
| Closed | Pester Chad E | $54,000 |
Source: Public Records
Tax History
| Year | Tax Paid | Tax Assessment Tax Assessment Total Assessment is a certain percentage of the fair market value that is determined by local assessors to be the total taxable value of land and additions on the property. | Land | Improvement |
|---|---|---|---|---|
| 2025 | $875 | $28,530 | $2,230 | $26,300 |
| 2024 | $905 | $28,530 | $2,230 | $26,300 |
| 2023 | $946 | $22,080 | $1,750 | $20,330 |
| 2022 | $898 | $22,082 | $1,750 | $20,332 |
| 2021 | $902 | $22,080 | $1,750 | $20,330 |
| 2020 | $898 | $18,870 | $1,560 | $17,310 |
| 2019 | $716 | $18,210 | $1,750 | $16,460 |
| 2018 | $696 | $18,210 | $1,750 | $16,460 |
| 2017 | $668 | $18,210 | $1,750 | $16,460 |
| 2016 | $668 | $18,870 | $1,560 | $17,310 |
| 2015 | $658 | $18,870 | $1,560 | $17,310 |
| 2014 | $641 | $18,870 | $1,560 | $17,310 |
| 2013 | $662 | $18,870 | $1,560 | $17,310 |
Source: Public Records
Map
Nearby Homes
Your Personal Tour Guide
Ask me questions while you tour the home.