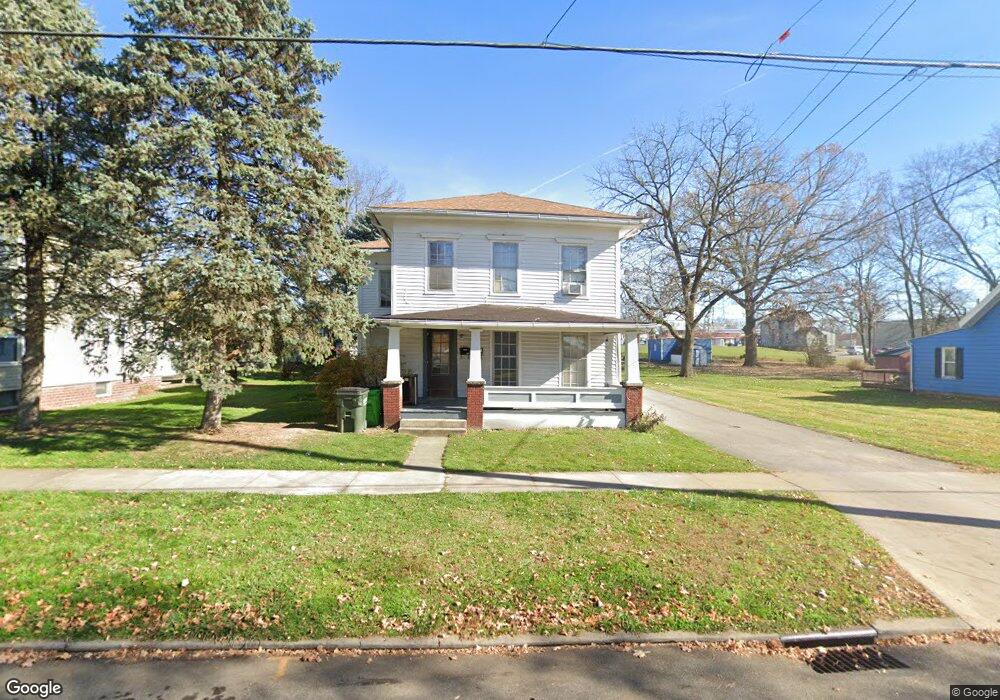
322 S Walnut St Wooster, OH 44691
Estimated Value: $95,000 - $185,000
2
Beds
2
Baths
4,602
Sq Ft
$31/Sq Ft
Est. Value
About This Home
This home is located at 322 S Walnut St, Wooster, OH 44691 and is currently estimated at $144,619, approximately $31 per square foot. 322 S Walnut St is a home located in Wayne County with nearby schools including Parkview Elementary School, Edgewood Middle School, and Wooster High School.
Ownership History
Date
Name
Owned For
Owner Type
Purchase Details
Closed on
Oct 15, 2021
Sold by
Campbell Kathy Dean
Bought by
Campbell William Franklin
Current Estimated Value
Purchase Details
Closed on
Aug 7, 2012
Sold by
Estate Of William F Campbell
Bought by
Campbell Kathy Dean
Purchase Details
Closed on
Jan 1, 1987
Bought by
Campbell William F and Campbell Kath
Create a Home Valuation Report for This Property
The Home Valuation Report is an in-depth analysis detailing your home's value as well as a comparison with similar homes in the area
Home Values in the Area
Average Home Value in this Area
Purchase History
| Date | Buyer | Sale Price | Title Company |
|---|---|---|---|
| Campbell William Franklin | $50,000 | None Available | |
| Campbell Kathy Dean | -- | None Available | |
| Campbell William F | -- | -- |
Source: Public Records
Mortgage History
| Date | Status | Borrower | Loan Amount |
|---|---|---|---|
| Closed | Campbell William Franklin | $0 |
Source: Public Records
Tax History
| Year | Tax Paid | Tax Assessment Tax Assessment Total Assessment is a certain percentage of the fair market value that is determined by local assessors to be the total taxable value of land and additions on the property. | Land | Improvement |
|---|---|---|---|---|
| 2025 | $1,912 | $45,170 | $6,230 | $38,940 |
| 2024 | $1,912 | $45,170 | $6,230 | $38,940 |
| 2023 | $1,918 | $45,170 | $6,230 | $38,940 |
| 2022 | $1,978 | $37,020 | $5,100 | $31,920 |
| 2021 | $1,551 | $37,020 | $5,100 | $31,920 |
| 2020 | $1,472 | $37,020 | $5,100 | $31,920 |
| 2019 | $1,333 | $33,280 | $5,940 | $27,340 |
| 2018 | $1,336 | $33,280 | $5,940 | $27,340 |
| 2017 | $1,338 | $33,280 | $5,940 | $27,340 |
| 2016 | $1,371 | $32,010 | $5,720 | $26,290 |
| 2015 | $1,347 | $32,010 | $5,720 | $26,290 |
| 2014 | $1,347 | $32,010 | $5,720 | $26,290 |
| 2013 | $1,354 | $31,860 | $7,840 | $24,020 |
Source: Public Records
Map
Nearby Homes
- 219 Mulberry St
- 140 Ohio St
- 227 N Walnut St
- 223 E Larwill St
- 5 E Melrose Unit 5
- 4859 Prosperity Way
- 423 N Market St
- 230 Clark Ave
- 419 Nold Ave
- 331 Derr Ave
- 534 N Buckeye St
- 328 W Bowman St
- 134 E Bowman St Unit 1/2
- 814 N Bever St
- 513 Washington St
- 851 Park Blvd
- 1117 Quinby Ave
- 938 Washington St
- 960 Washington St
- 1500 Burbank Rd
Your Personal Tour Guide
Ask me questions while you tour the home.