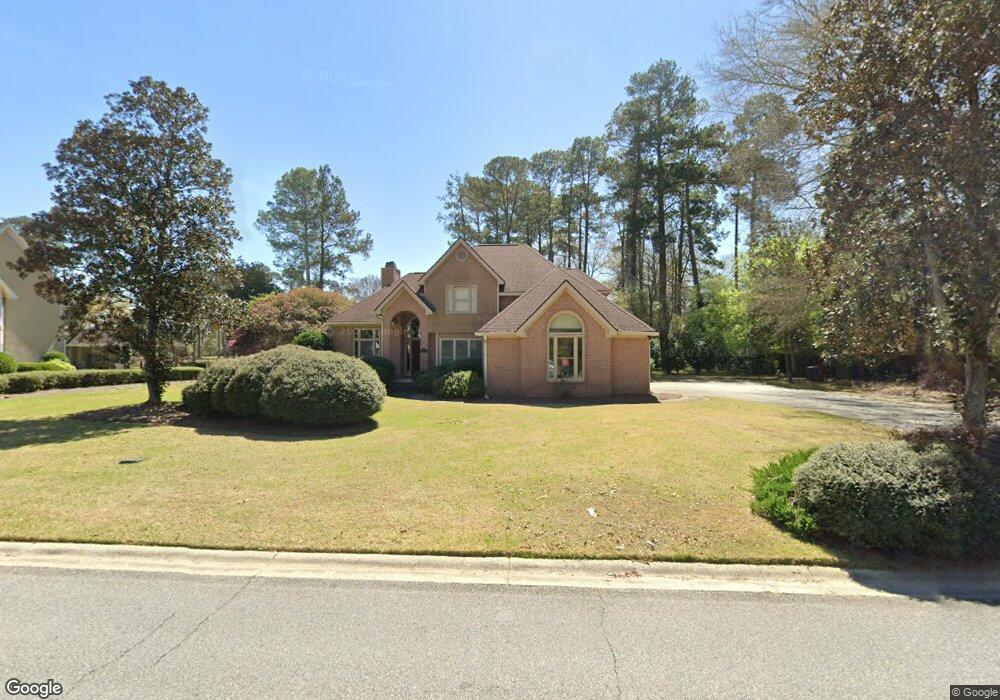
322 Stathams Way Warner Robins, GA 31088
Estimated Value: $401,000 - $468,000
--
Bed
1
Bath
2,868
Sq Ft
$151/Sq Ft
Est. Value
About This Home
This home is located at 322 Stathams Way, Warner Robins, GA 31088 and is currently estimated at $434,407, approximately $151 per square foot. 322 Stathams Way is a home located in Houston County with nearby schools including Bonaire Elementary School, Huntington Middle School, and Warner Robins High School.
Ownership History
Date
Name
Owned For
Owner Type
Purchase Details
Closed on
Oct 26, 2020
Sold by
Shores Mark A
Bought by
Shores Mark A and Shores Yuni C
Current Estimated Value
Purchase Details
Closed on
Sep 15, 2020
Sold by
Shores Mark A
Bought by
Shores Mark A and Shores Yuni C
Purchase Details
Closed on
Aug 3, 2005
Sold by
Radford Ronnie R and Radford Nancy H
Bought by
Shores Mark A
Purchase Details
Closed on
Dec 27, 1995
Sold by
Harris Edward L and Harris Betty S
Bought by
Radford Ronnie R and Radford Nancy H
Purchase Details
Closed on
Dec 26, 1995
Sold by
Happel Construction Co Inc
Bought by
Harris Edward L and Harris Betty S
Purchase Details
Closed on
Jan 19, 1994
Sold by
Happel Construction Co Inc
Bought by
Harris Edward L and Harris Betty S
Purchase Details
Closed on
Feb 3, 1993
Bought by
Happel Construction Co Inc
Create a Home Valuation Report for This Property
The Home Valuation Report is an in-depth analysis detailing your home's value as well as a comparison with similar homes in the area
Home Values in the Area
Average Home Value in this Area
Purchase History
| Date | Buyer | Sale Price | Title Company |
|---|---|---|---|
| Shores Mark A | -- | None Available | |
| Shores Mark A | -- | None Available | |
| Shores Mark A | -- | None Listed On Document | |
| Shores Mark A | $294,000 | -- | |
| Radford Ronnie R | $219,000 | -- | |
| Harris Edward L | -- | -- | |
| Harris Edward L | $194,500 | -- | |
| Happel Construction Co Inc | $31,500 | -- |
Source: Public Records
Tax History Compared to Growth
Tax History
| Year | Tax Paid | Tax Assessment Tax Assessment Total Assessment is a certain percentage of the fair market value that is determined by local assessors to be the total taxable value of land and additions on the property. | Land | Improvement |
|---|---|---|---|---|
| 2024 | $3,388 | $143,640 | $17,200 | $126,440 |
| 2023 | $2,916 | $122,640 | $17,200 | $105,440 |
| 2022 | $2,660 | $112,040 | $17,200 | $94,840 |
| 2021 | $2,477 | $103,960 | $17,200 | $86,760 |
| 2020 | $2,341 | $97,920 | $17,200 | $80,720 |
| 2019 | $2,341 | $97,920 | $17,200 | $80,720 |
| 2018 | $2,341 | $97,920 | $17,200 | $80,720 |
| 2017 | $2,344 | $97,920 | $17,200 | $80,720 |
| 2016 | $2,347 | $97,920 | $17,200 | $80,720 |
| 2015 | $2,352 | $97,920 | $17,200 | $80,720 |
| 2014 | -- | $103,120 | $17,200 | $85,920 |
| 2013 | -- | $103,120 | $17,200 | $85,920 |
Source: Public Records
Map
Nearby Homes
- 216 Stathams Way
- 104 Bunkers Trail
- 215 Falcon Crest
- 256 Falcon Crest Unit STATHAMS LANDING
- 215 Falcon Crest Unit Stathams Landing
- 256 Falcon Crest
- 107 Shadowood Dr
- 100 Deerwood Dr
- 107 Deerwood Dr
- 100 Huxley Terrace
- 308 Piedmont Ln
- 204 Thornton Dr
- 307 Apalachee Way
- 2001 Pin Oak Terrace
- 310 Davids Place Dr
- 312 Davids Place Dr
- 104 Hampton Meadows Dr
- 506 Toccoa Ct
- 507 Toccoa Ct
- Brunswick Plan at Riverbend North
- 324 Stathams Way
- 304 Fairways Dr
- 302 Fairways Dr
- 100 Hampton Point
- 319 Stathams Way
- 300 Fairways Dr
- 321 Stathams Way
- 305 Fairways Dr
- 103 Huntshire Trace
- 102 Hampton Point
- 101 Huntshire Trace
- 303 Fairways Dr
- 101 Fifth Fairway
- 330 Stathams Way
- 317 Stathams Way
- 107 Huntshire Trace
- 103 5th Fairway
- 103 Fifth Fairway
- 316 Stathams Way
- 104 Hampton Pointe