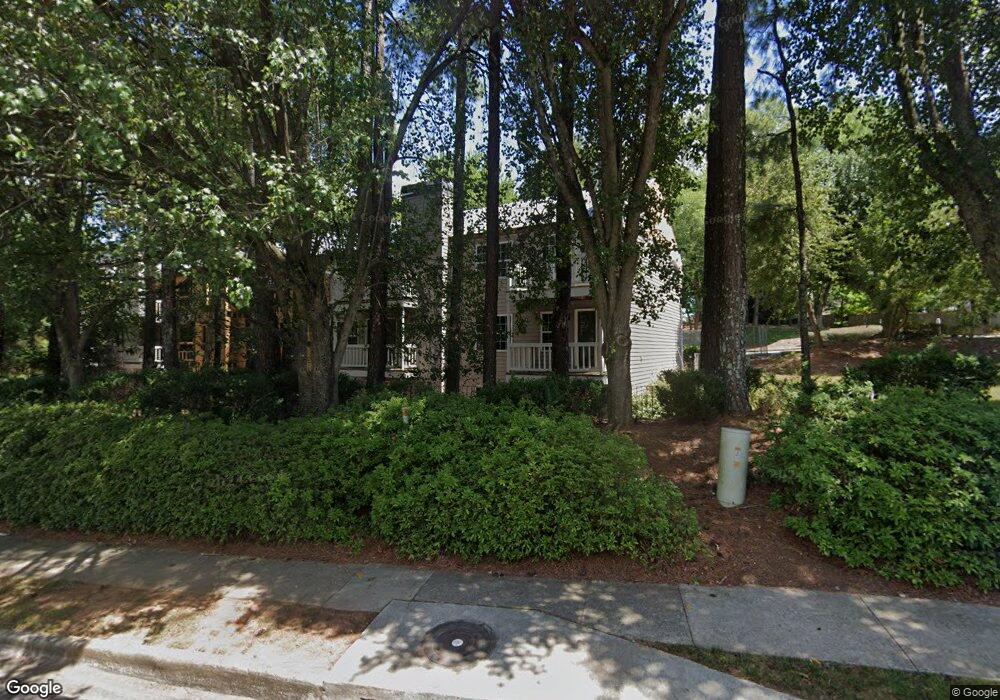
322 Teal Ct Unit 322 Roswell, GA 30076
Martin's Landing NeighborhoodEstimated Value: $204,000 - $229,688
2
Beds
2
Baths
900
Sq Ft
$245/Sq Ft
Est. Value
About This Home
This home is located at 322 Teal Ct Unit 322, Roswell, GA 30076 and is currently estimated at $220,922, approximately $245 per square foot. 322 Teal Ct Unit 322 is a home located in Fulton County with nearby schools including Jackson Elementary School, Holcomb Bridge Middle School, and Centennial High School.
Ownership History
Date
Name
Owned For
Owner Type
Purchase Details
Closed on
Sep 15, 2006
Sold by
Vicario Lawrence
Bought by
Dawney Lindsey and Stetson James
Current Estimated Value
Home Financials for this Owner
Home Financials are based on the most recent Mortgage that was taken out on this home.
Original Mortgage
$105,000
Outstanding Balance
$62,297
Interest Rate
6.45%
Mortgage Type
New Conventional
Estimated Equity
$158,625
Purchase Details
Closed on
Feb 22, 1995
Sold by
Cochran Susan J
Bought by
Vicario Lawrence J
Create a Home Valuation Report for This Property
The Home Valuation Report is an in-depth analysis detailing your home's value as well as a comparison with similar homes in the area
Home Values in the Area
Average Home Value in this Area
Purchase History
| Date | Buyer | Sale Price | Title Company |
|---|---|---|---|
| Dawney Lindsey | $105,000 | -- | |
| Vicario Lawrence J | $5,700 | -- |
Source: Public Records
Mortgage History
| Date | Status | Borrower | Loan Amount |
|---|---|---|---|
| Open | Dawney Lindsey | $105,000 | |
| Closed | Vicario Lawrence J | $0 |
Source: Public Records
Tax History Compared to Growth
Tax History
| Year | Tax Paid | Tax Assessment Tax Assessment Total Assessment is a certain percentage of the fair market value that is determined by local assessors to be the total taxable value of land and additions on the property. | Land | Improvement |
|---|---|---|---|---|
| 2025 | $396 | $93,200 | $12,840 | $80,360 |
| 2023 | $1,888 | $66,880 | $8,120 | $58,760 |
| 2022 | $1,642 | $62,400 | $7,400 | $55,000 |
| 2021 | $1,755 | $55,120 | $8,480 | $46,640 |
| 2020 | $1,733 | $52,920 | $7,040 | $45,880 |
| 2019 | $241 | $48,680 | $5,800 | $42,880 |
| 2018 | $1,162 | $41,160 | $5,320 | $35,840 |
| 2017 | $813 | $27,880 | $2,760 | $25,120 |
| 2016 | $814 | $27,880 | $2,760 | $25,120 |
| 2015 | $969 | $27,880 | $2,760 | $25,120 |
| 2014 | $606 | $19,760 | $2,800 | $16,960 |
Source: Public Records
Map
Nearby Homes
- 324 Teal Ct
- 406 Teal Ct
- 227 Quail Run
- 150 N Pond Ct Unit 1
- 309 Quail Run
- 311 Quail Run
- 263 Quail Run
- 230 Lakeview Ridge E
- 130 Lakeview Ridge W
- 125 N Pond Way
- 225 Winterberry Ct
- 230 Winterberry Ct
- 9470 Hillside Dr
- 645 Trailmore Place
- 315 Sea Holly Cir
- 1265 Northshore Dr
- 2240 Six Branches Dr
- 1045 Martin Ridge Rd
- 420 Little Pines Ct
- 1140 Northshore Dr