322 Teresa Atkinson Ln Royston, GA 30662
Estimated Value: $166,000 - $235,000
3
Beds
2
Baths
1,632
Sq Ft
$123/Sq Ft
Est. Value
About This Home
This home is located at 322 Teresa Atkinson Ln, Royston, GA 30662 and is currently estimated at $200,500, approximately $122 per square foot. 322 Teresa Atkinson Ln is a home located in Franklin County with nearby schools including Franklin County High School.
Ownership History
Date
Name
Owned For
Owner Type
Purchase Details
Closed on
Aug 13, 2019
Sold by
Lunsford Aubery
Bought by
Red Land Grp Llc
Current Estimated Value
Home Financials for this Owner
Home Financials are based on the most recent Mortgage that was taken out on this home.
Original Mortgage
$1,923,950
Interest Rate
3.8%
Mortgage Type
Commercial
Purchase Details
Closed on
Mar 28, 2019
Sold by
Smith Ricky
Bought by
Rms Ventures Llc
Home Financials for this Owner
Home Financials are based on the most recent Mortgage that was taken out on this home.
Original Mortgage
$250,000
Interest Rate
4.3%
Mortgage Type
Commercial
Purchase Details
Closed on
Jan 16, 2019
Sold by
Phillips Scott David
Bought by
Lunsford Aubery and Smith Ricky
Purchase Details
Closed on
Jun 22, 2018
Sold by
Phillips Scott David
Bought by
Davis Thomas M and Day Davis Kimberly S
Purchase Details
Closed on
Nov 15, 1994
Bought by
Dudley Joyce B
Purchase Details
Closed on
Nov 11, 1994
Sold by
Shackelford William
Bought by
Phillips Scott David
Create a Home Valuation Report for This Property
The Home Valuation Report is an in-depth analysis detailing your home's value as well as a comparison with similar homes in the area
Home Values in the Area
Average Home Value in this Area
Purchase History
| Date | Buyer | Sale Price | Title Company |
|---|---|---|---|
| Red Land Grp Llc | $1,999,999 | -- | |
| Rms Ventures Llc | -- | -- | |
| Lunsford Aubery | $55,000 | -- | |
| Lunsford Aubery | $105,000 | -- | |
| Davis Thomas M | $16,500 | -- | |
| Davis Thomas M | $33,000 | -- | |
| Dudley Joyce B | -- | -- | |
| Phillips Scott David | -- | -- |
Source: Public Records
Mortgage History
| Date | Status | Borrower | Loan Amount |
|---|---|---|---|
| Closed | Red Land Grp Llc | $1,923,950 | |
| Previous Owner | Rms Ventures Llc | $250,000 |
Source: Public Records
Tax History Compared to Growth
Tax History
| Year | Tax Paid | Tax Assessment Tax Assessment Total Assessment is a certain percentage of the fair market value that is determined by local assessors to be the total taxable value of land and additions on the property. | Land | Improvement |
|---|---|---|---|---|
| 2024 | $4,073 | $231,936 | $78,536 | $153,400 |
| 2023 | $4,393 | $224,798 | $71,398 | $153,400 |
| 2022 | $4,357 | $83,168 | $55,400 | $27,768 |
| 2021 | $5,649 | $82,168 | $56,780 | $25,388 |
| 2020 | $5,446 | $72,705 | $47,317 | $25,388 |
| 2019 | $1,360 | $50,628 | $50,628 | $0 |
| 2018 | $1,684 | $62,705 | $57,593 | $5,112 |
| 2017 | $516 | $62,705 | $57,593 | $5,112 |
| 2016 | $509 | $62,047 | $57,593 | $4,454 |
| 2015 | -- | $62,046 | $57,593 | $4,454 |
| 2014 | -- | $62,060 | $57,593 | $4,467 |
| 2013 | -- | $62,060 | $57,593 | $4,467 |
Source: Public Records
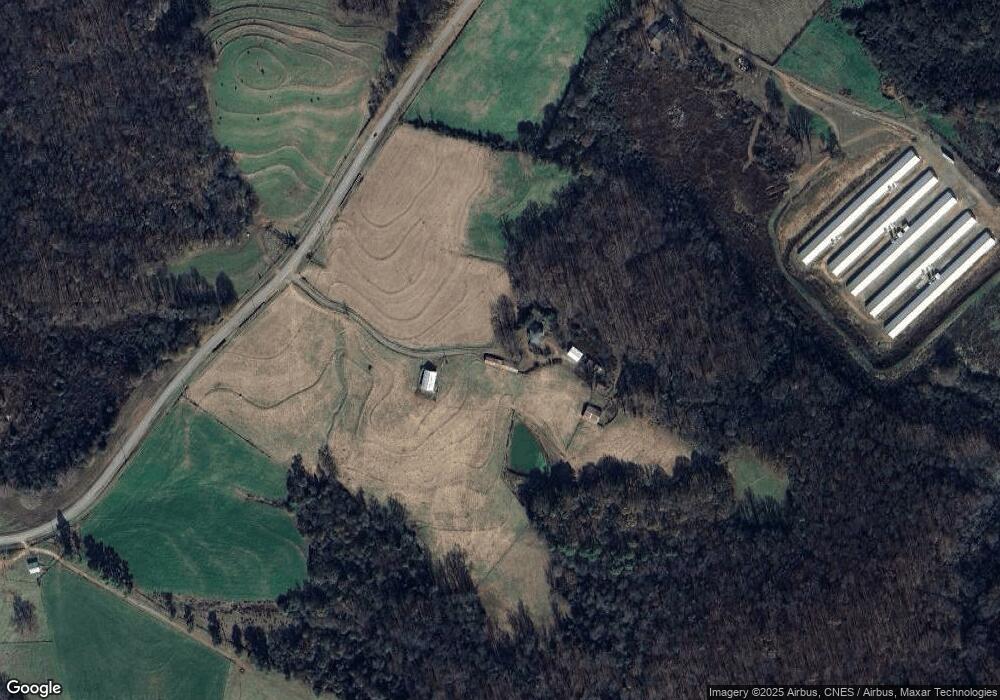
Map
Nearby Homes
- 1291 Brays Lake Rd
- 2695 Brays Lake Rd
- 4308 Athens Rd
- 0 Nails Creek Crossing Unit 10584678
- 1079 Hardeman Farm Rd
- 9 Dons Ct
- 31 Dons Ct
- 41 Manley Terrace
- 499 Aderhold Rd
- 1000 Nails Creek Crossing
- 8188 Sandy Cross Rd
- 456 Aderhold Rd
- 340 Telford Rd
- 0 Murphy Rd Unit 10585891
- 110 Telford Rd
- 210 Nora Moss Ln
- 7690 Royston Rd
- 0 Georgia 198
- 7 Crest View Cir
- 110 Adaline Ct
- 711 Shackelford Rd
- 191 Teresa Atkinson Ln
- 878 Shackelford Rd
- 1001 Shackelford Rd
- 501 Shackelford Rd
- 501 Shackelford Rd
- 1649 Brays Lake Rd
- 446 Shackelford Rd
- 1912 Brays Lake Rd
- 2058 Brays Lake Rd
- 0 Shackleford Rd Unit 20045136
- 0 Shackleford Rd Unit 20043393
- 0 Shackleford Rd Unit 7255996
- 0 Shackleford Rd Unit 3060200
- 0 Shackleford Rd Unit 7100270
- 0 Shackleford Rd Unit 3060443
- 878 Shackleford Road Royston Ga 30662
- 508 Shackelford Rd
- 1526 Brays Lake Rd
- 5040 Athens Rd