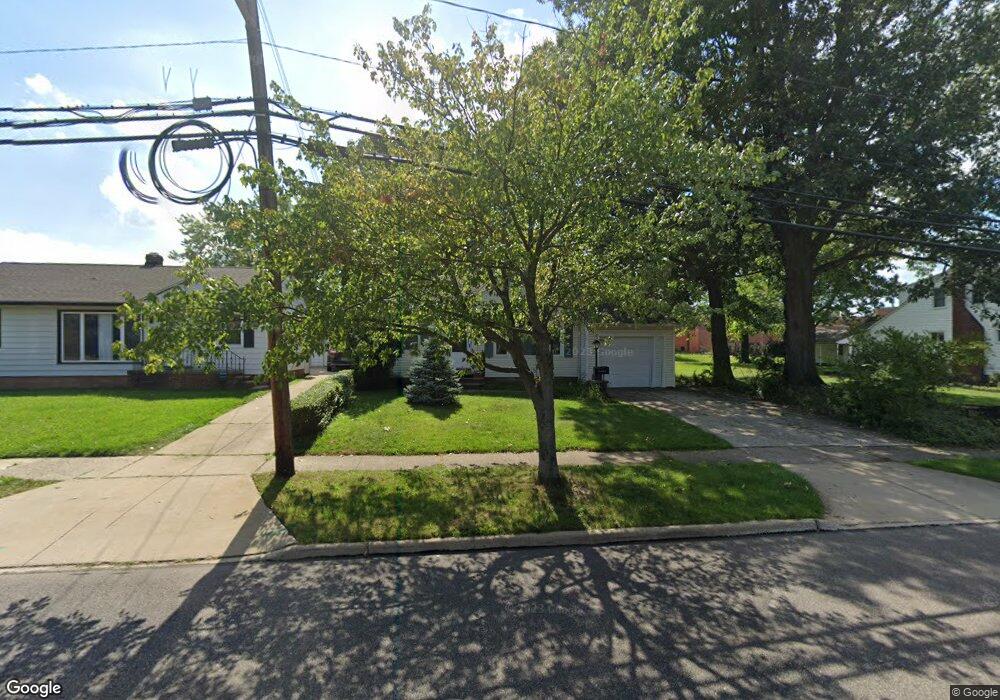
322 Union St Bedford, OH 44146
Estimated Value: $84,000 - $146,000
2
Beds
1
Bath
864
Sq Ft
$134/Sq Ft
Est. Value
About This Home
This home is located at 322 Union St, Bedford, OH 44146 and is currently estimated at $115,426, approximately $133 per square foot. 322 Union St is a home located in Cuyahoga County with nearby schools including Heskett Middle School, Bedford High School, and Ohio College Preparatory School.
Ownership History
Date
Name
Owned For
Owner Type
Purchase Details
Closed on
Dec 3, 2002
Sold by
Snyder Gregory G and Snyder Krystal
Bought by
Pojman Paul E
Current Estimated Value
Home Financials for this Owner
Home Financials are based on the most recent Mortgage that was taken out on this home.
Original Mortgage
$85,500
Outstanding Balance
$35,050
Interest Rate
6.38%
Estimated Equity
$80,376
Purchase Details
Closed on
Aug 8, 1998
Sold by
Matsko Michael
Bought by
Snyder Gregory G
Home Financials for this Owner
Home Financials are based on the most recent Mortgage that was taken out on this home.
Original Mortgage
$73,722
Interest Rate
6.97%
Mortgage Type
FHA
Purchase Details
Closed on
Dec 23, 1988
Sold by
Matsko Mary V
Bought by
Matsko Michael
Purchase Details
Closed on
Mar 17, 1977
Sold by
Matsko Joseph J and Matsko Mary
Bought by
Matsko Mary
Purchase Details
Closed on
Jan 1, 1975
Bought by
Matsko Joseph J and Matsko Mary
Create a Home Valuation Report for This Property
The Home Valuation Report is an in-depth analysis detailing your home's value as well as a comparison with similar homes in the area
Home Values in the Area
Average Home Value in this Area
Purchase History
| Date | Buyer | Sale Price | Title Company |
|---|---|---|---|
| Pojman Paul E | $95,300 | Asta | |
| Snyder Gregory G | $74,000 | Executive Title Agency Corp | |
| Matsko Michael | -- | -- | |
| Matsko Mary | -- | -- | |
| Matsko Joseph J | -- | -- |
Source: Public Records
Mortgage History
| Date | Status | Borrower | Loan Amount |
|---|---|---|---|
| Open | Pojman Paul E | $85,500 | |
| Previous Owner | Snyder Gregory G | $73,722 |
Source: Public Records
Tax History
| Year | Tax Paid | Tax Assessment Tax Assessment Total Assessment is a certain percentage of the fair market value that is determined by local assessors to be the total taxable value of land and additions on the property. | Land | Improvement |
|---|---|---|---|---|
| 2025 | $1,979 | $33,810 | $8,260 | $25,550 |
| 2024 | $1,976 | $33,810 | $8,260 | $25,550 |
| 2023 | $2,125 | $31,820 | $7,040 | $24,780 |
| 2022 | $1,920 | $31,820 | $7,040 | $24,780 |
| 2021 | $1,849 | $31,820 | $7,040 | $24,780 |
| 2020 | $1,632 | $26,740 | $5,920 | $20,830 |
| 2019 | $1,593 | $76,400 | $16,900 | $59,500 |
| 2018 | $1,585 | $26,740 | $5,920 | $20,830 |
| 2017 | $1,530 | $25,100 | $5,460 | $19,640 |
| 2016 | $2,218 | $25,100 | $5,460 | $19,640 |
| 2015 | $2,211 | $25,100 | $5,460 | $19,640 |
| 2014 | $2,211 | $27,270 | $5,950 | $21,320 |
Source: Public Records
Map
Nearby Homes
Your Personal Tour Guide
Ask me questions while you tour the home.