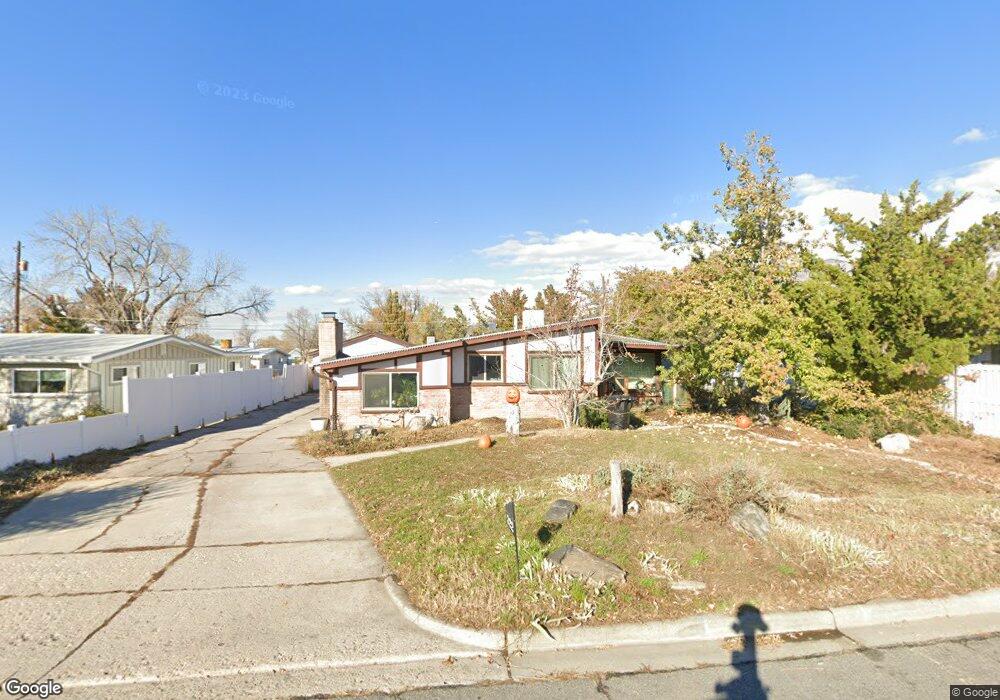
322 W 1050 N Bountiful, UT 84010
Estimated Value: $432,000 - $483,000
4
Beds
2
Baths
1,584
Sq Ft
$292/Sq Ft
Est. Value
About This Home
This home is located at 322 W 1050 N, Bountiful, UT 84010 and is currently estimated at $462,859, approximately $292 per square foot. 322 W 1050 N is a home located in Davis County with nearby schools including Meadowbrook Elementary School, Bountiful Junior High School, and Viewmont High School.
Ownership History
Date
Name
Owned For
Owner Type
Purchase Details
Closed on
Aug 18, 2017
Sold by
Ventura Michael A and Ventura Julie A
Bought by
Ventura Michael and Ventura Julie
Current Estimated Value
Home Financials for this Owner
Home Financials are based on the most recent Mortgage that was taken out on this home.
Original Mortgage
$147,800
Outstanding Balance
$123,560
Interest Rate
4.03%
Mortgage Type
New Conventional
Estimated Equity
$339,299
Purchase Details
Closed on
Oct 15, 2010
Sold by
Ventura Michael A and Godfrey Julie A
Bought by
Ventura Michael A and Ventura Julie A
Purchase Details
Closed on
Jun 22, 2009
Sold by
Jeppsen Dana Milton
Bought by
Ventura Michael A and Godfrey Julie A
Home Financials for this Owner
Home Financials are based on the most recent Mortgage that was taken out on this home.
Original Mortgage
$171,830
Interest Rate
4.82%
Mortgage Type
FHA
Purchase Details
Closed on
Jul 8, 2005
Sold by
Hadfield Beverly J
Bought by
Hadfield Beverly Jean
Create a Home Valuation Report for This Property
The Home Valuation Report is an in-depth analysis detailing your home's value as well as a comparison with similar homes in the area
Purchase History
| Date | Buyer | Sale Price | Title Company |
|---|---|---|---|
| Ventura Michael | -- | Cottonwood Title | |
| Ventura Michael A | -- | Accommodation | |
| Ventura Michael A | -- | First American Title | |
| Hadfield Beverly Jean | -- | First American Title |
Source: Public Records
Mortgage History
| Date | Status | Borrower | Loan Amount |
|---|---|---|---|
| Open | Ventura Michael | $147,800 | |
| Closed | Ventura Michael A | $171,830 |
Source: Public Records
Tax History
| Year | Tax Paid | Tax Assessment Tax Assessment Total Assessment is a certain percentage of the fair market value that is determined by local assessors to be the total taxable value of land and additions on the property. | Land | Improvement |
|---|---|---|---|---|
| 2025 | $2,558 | $229,900 | $127,547 | $102,353 |
| 2024 | $2,424 | $227,150 | $112,587 | $114,563 |
| 2023 | $2,318 | $394,000 | $208,455 | $185,545 |
| 2022 | $2,310 | $215,050 | $114,184 | $100,866 |
| 2021 | $2,128 | $303,000 | $149,380 | $153,620 |
| 2020 | $1,879 | $268,000 | $127,978 | $140,022 |
| 2019 | $1,901 | $265,000 | $137,730 | $127,270 |
| 2018 | $1,761 | $241,000 | $135,067 | $105,933 |
| 2016 | $1,453 | $107,250 | $55,716 | $51,534 |
| 2015 | $1,420 | $98,890 | $55,716 | $43,174 |
| 2014 | $1,427 | $102,556 | $55,716 | $46,840 |
| 2013 | -- | $96,845 | $36,190 | $60,655 |
Source: Public Records
Map
Nearby Homes
- 366 W 1000 N
- 235 W 1400 N
- 1130 N 200 W
- 1260 N 200 W
- 184 Park Shadows Cir
- 1520 N 550 W
- 1625 Pages Place
- 563 N 200 W
- 328 W Pages Ln
- 106 W 700 N
- 499 N 200 W Unit 30
- 401 W 400 N Unit 49
- 204 Lyman Ln
- 951 Centerville Commons Way
- 399 W 400 N Unit 47
- 1420 N Main St
- 1767 N 600 W
- 332 N 300 W
- 96 Village Square Rd
- 290 N 500 W Unit 108
Your Personal Tour Guide
Ask me questions while you tour the home.