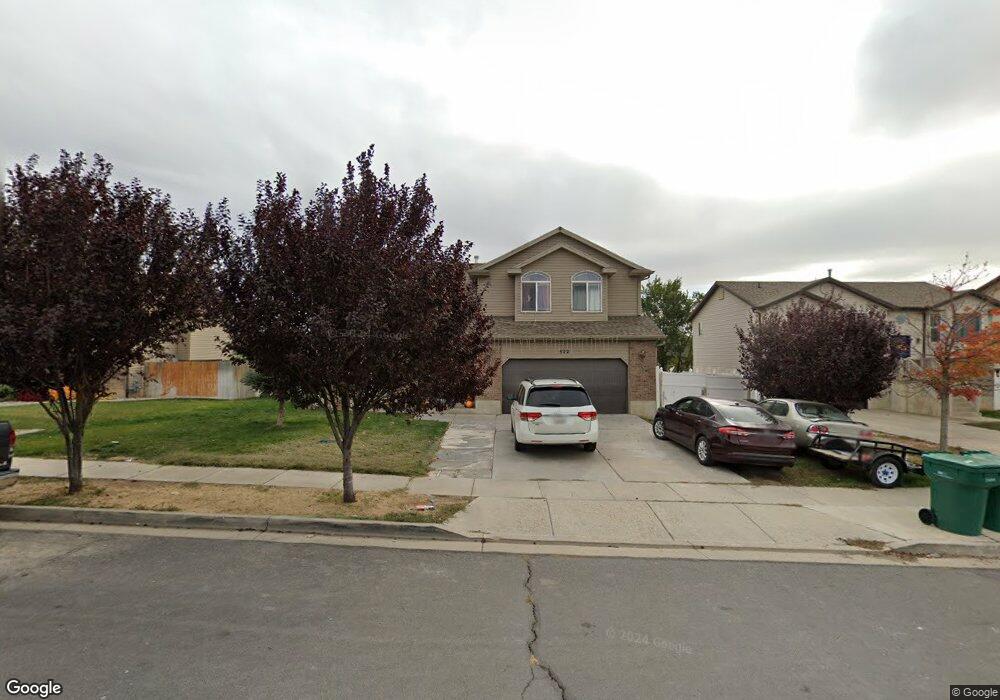
322 W 200 N Clearfield, UT 84015
Estimated Value: $413,000 - $485,000
5
Beds
2
Baths
1,859
Sq Ft
$239/Sq Ft
Est. Value
About This Home
This home is located at 322 W 200 N, Clearfield, UT 84015 and is currently estimated at $445,226, approximately $239 per square foot. 322 W 200 N is a home located in Davis County with nearby schools including Holt Elementary School, North Davis Junior High School, and Clearfield High School.
Ownership History
Date
Name
Owned For
Owner Type
Purchase Details
Closed on
May 23, 2007
Sold by
Rasmussen Shawn and Rasmussen Shannon
Bought by
Hernandez Beatriz E
Current Estimated Value
Home Financials for this Owner
Home Financials are based on the most recent Mortgage that was taken out on this home.
Original Mortgage
$183,510
Outstanding Balance
$111,684
Interest Rate
6.18%
Mortgage Type
Purchase Money Mortgage
Estimated Equity
$333,542
Purchase Details
Closed on
Nov 14, 2006
Sold by
Ivins Kevin
Bought by
Homestead Construction Inc
Home Financials for this Owner
Home Financials are based on the most recent Mortgage that was taken out on this home.
Original Mortgage
$146,200
Interest Rate
6.36%
Mortgage Type
Construction
Purchase Details
Closed on
Nov 3, 2006
Sold by
Homestead Construction Inc
Bought by
Rasmussen Shawn and Rasmussen Shannon
Home Financials for this Owner
Home Financials are based on the most recent Mortgage that was taken out on this home.
Original Mortgage
$146,200
Interest Rate
6.36%
Mortgage Type
Construction
Create a Home Valuation Report for This Property
The Home Valuation Report is an in-depth analysis detailing your home's value as well as a comparison with similar homes in the area
Home Values in the Area
Average Home Value in this Area
Purchase History
| Date | Buyer | Sale Price | Title Company |
|---|---|---|---|
| Hernandez Beatriz E | -- | Heritage West Title Ins Agen | |
| Homestead Construction Inc | -- | Intermountain Title | |
| Rasmussen Shawn | -- | Heritage West Title Ins Agen |
Source: Public Records
Mortgage History
| Date | Status | Borrower | Loan Amount |
|---|---|---|---|
| Open | Hernandez Beatriz E | $183,510 | |
| Previous Owner | Rasmussen Shawn | $146,200 |
Source: Public Records
Tax History Compared to Growth
Tax History
| Year | Tax Paid | Tax Assessment Tax Assessment Total Assessment is a certain percentage of the fair market value that is determined by local assessors to be the total taxable value of land and additions on the property. | Land | Improvement |
|---|---|---|---|---|
| 2025 | $2,682 | $240,350 | $72,093 | $168,257 |
| 2024 | $2,571 | $232,100 | $68,925 | $163,175 |
| 2023 | $2,378 | $394,000 | $110,323 | $283,677 |
| 2022 | $2,510 | $224,950 | $63,209 | $161,741 |
| 2021 | $2,290 | $310,000 | $67,057 | $242,943 |
| 2020 | $1,978 | $266,000 | $56,367 | $209,633 |
| 2019 | $1,914 | $254,000 | $59,172 | $194,828 |
| 2018 | $1,732 | $224,000 | $52,521 | $171,479 |
| 2016 | $1,477 | $99,825 | $20,970 | $78,855 |
| 2015 | $1,385 | $89,265 | $20,970 | $68,295 |
| 2014 | $1,530 | $99,942 | $20,970 | $78,972 |
| 2013 | -- | $92,525 | $32,571 | $59,954 |
Source: Public Records
Map
Nearby Homes
- 322 W 200 N Unit 9
- 332 W 200 N
- 332 W 200 N Unit 8
- 312 W 200 N
- 312 W 200 N Unit 10
- 325 W 160 N
- 335 W 160 N Unit 207
- 315 W 160 N Unit 209
- 342 W 200 N Unit 7
- 342 W 200 N
- 302 W 200 N
- 302 W 200 N Unit 11
- 317 W 200 N
- 317 W 200 N Unit 4
- 345 W 160 N
- 307 W 200 N
- 307 W 200 N Unit 3
- 327 W 200 N
- 327 W 200 N Unit 5
- 205 N 360 W