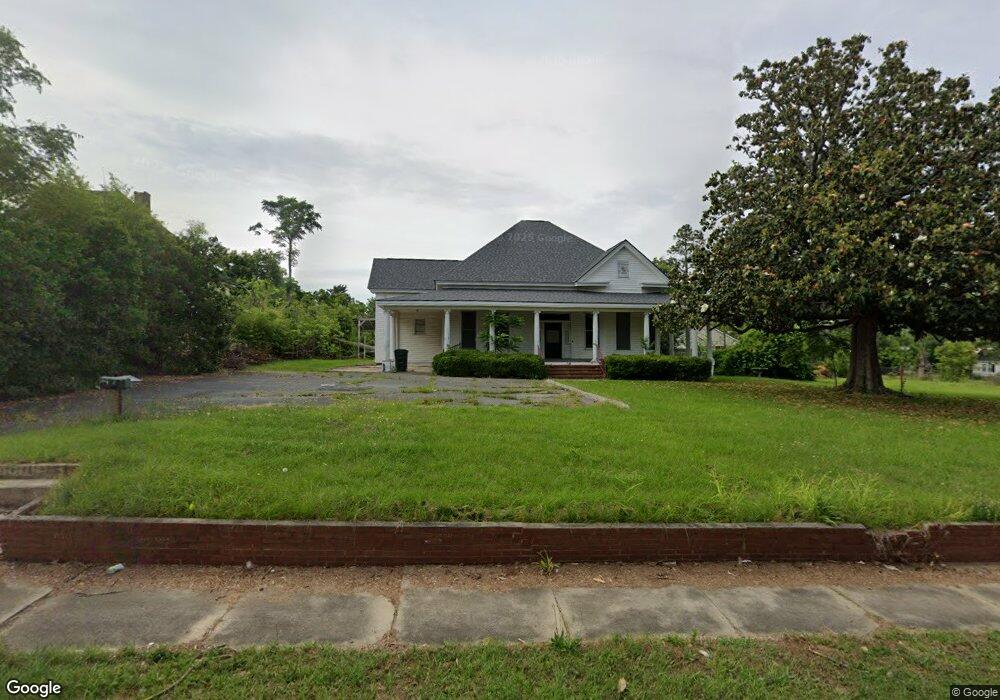
322 W Main St Swainsboro, GA 30401
Estimated Value: $121,000 - $214,119
4
Beds
2
Baths
1,408
Sq Ft
$110/Sq Ft
Est. Value
About This Home
This home is located at 322 W Main St, Swainsboro, GA 30401 and is currently estimated at $154,280, approximately $109 per square foot. 322 W Main St is a home located in Emanuel County with nearby schools including Swainsboro Primary School, Swainsboro Elementary School, and Swainsboro Middle School.
Ownership History
Date
Name
Owned For
Owner Type
Purchase Details
Closed on
Sep 19, 2024
Sold by
Griffin Angela
Bought by
Florida Land Trust 322Wms
Current Estimated Value
Purchase Details
Closed on
Oct 14, 2021
Sold by
Hayes Rita
Bought by
Newsome Earl
Purchase Details
Closed on
Sep 7, 2021
Sold by
Newsome Earl
Bought by
Hayes Rita
Purchase Details
Closed on
Dec 2, 2019
Sold by
Newsome Earl
Bought by
Jenkins Annette and Griffin Angela
Purchase Details
Closed on
Jan 5, 2017
Sold by
Loretta T
Bought by
Newsome Earl
Home Financials for this Owner
Home Financials are based on the most recent Mortgage that was taken out on this home.
Original Mortgage
$56,470
Interest Rate
4.13%
Purchase Details
Closed on
Jun 6, 2007
Sold by
Newsome Jenkins Annette
Bought by
Newsome Earl
Purchase Details
Closed on
Jul 20, 1993
Bought by
Pittman Loretta T
Create a Home Valuation Report for This Property
The Home Valuation Report is an in-depth analysis detailing your home's value as well as a comparison with similar homes in the area
Home Values in the Area
Average Home Value in this Area
Purchase History
| Date | Buyer | Sale Price | Title Company |
|---|---|---|---|
| Florida Land Trust 322Wms | $61,000 | -- | |
| Newsome Earl | -- | -- | |
| Hayes Rita | $3,400 | -- | |
| Jenkins Annette | -- | -- | |
| Newsome Earl | $65,000 | -- | |
| Newsome Earl | $10,000 | -- | |
| Pittman Loretta T | $47,000 | -- |
Source: Public Records
Mortgage History
| Date | Status | Borrower | Loan Amount |
|---|---|---|---|
| Previous Owner | Newsome Earl | $56,470 |
Source: Public Records
Tax History Compared to Growth
Tax History
| Year | Tax Paid | Tax Assessment Tax Assessment Total Assessment is a certain percentage of the fair market value that is determined by local assessors to be the total taxable value of land and additions on the property. | Land | Improvement |
|---|---|---|---|---|
| 2024 | $1,675 | $42,670 | $13,680 | $28,990 |
| 2023 | $1,590 | $40,536 | $13,680 | $26,856 |
| 2022 | $941 | $37,892 | $13,680 | $24,212 |
| 2021 | $936 | $36,964 | $14,400 | $22,564 |
| 2020 | $854 | $31,944 | $18,358 | $13,586 |
| 2019 | $854 | $31,944 | $18,358 | $13,586 |
| 2018 | $1,056 | $39,938 | $20,398 | $19,540 |
| 2017 | $907 | $34,196 | $20,398 | $13,798 |
| 2016 | $1,044 | $39,372 | $20,398 | $18,974 |
| 2015 | -- | $46,182 | $22,654 | $23,528 |
| 2014 | -- | $63,236 | $22,654 | $40,582 |
| 2013 | -- | $61,659 | $22,654 | $39,005 |
Source: Public Records
Map
Nearby Homes
- 327 W Church St
- 316 W Moring St
- 219 Lucky St
- 547 W Moring St
- 532 Calhoun St
- 209 Price St
- 323 N Main St
- 400 N Main St
- 402 N Main St
- 331 S Green St
- 555 Jordan Ln
- 14.53 ACRES Gumlog Rd
- 625 N Main St
- 508 Barbara Ave
- 423 E Martin Luther King Junior Blvd
- 118 Pierce Ave
- 646 N Main St
- 217 Fowler St
- 629 Thompson Rd
- 0 Mcleod Dr