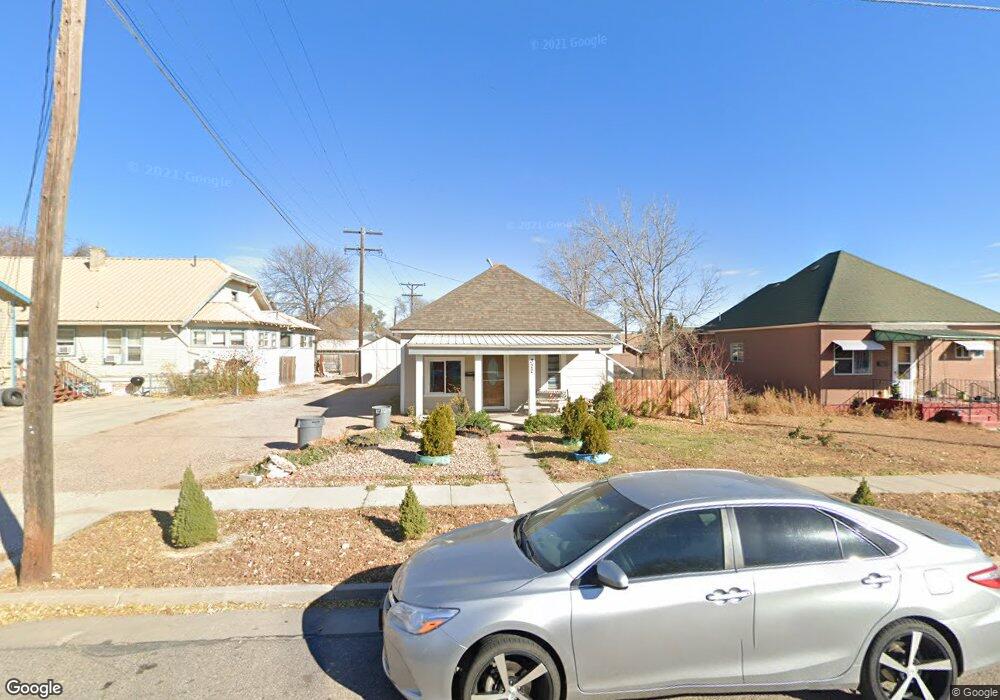
322 Walnut St Sterling, CO 80751
Estimated Value: $162,000 - $176,000
3
Beds
1
Bath
1,096
Sq Ft
$152/Sq Ft
Est. Value
About This Home
This home is located at 322 Walnut St, Sterling, CO 80751 and is currently estimated at $166,298, approximately $151 per square foot. 322 Walnut St is a home located in Logan County with nearby schools including Campbell Elementary School, Ayres Elementary School, and Sterling Middle School.
Ownership History
Date
Name
Owned For
Owner Type
Purchase Details
Closed on
Sep 19, 2016
Sold by
Flores Residential Llc
Bought by
Morales Freyre Sergio D
Current Estimated Value
Purchase Details
Closed on
Feb 12, 2013
Sold by
Flores Rafael R and Flores Rafael
Bought by
Flores Residential Llc
Purchase Details
Closed on
Jun 9, 2010
Sold by
Manhalter Donald H
Bought by
Flores Rafael
Home Financials for this Owner
Home Financials are based on the most recent Mortgage that was taken out on this home.
Original Mortgage
$76,427
Interest Rate
5.02%
Mortgage Type
Future Advance Clause Open End Mortgage
Create a Home Valuation Report for This Property
The Home Valuation Report is an in-depth analysis detailing your home's value as well as a comparison with similar homes in the area
Purchase History
| Date | Buyer | Sale Price | Title Company |
|---|---|---|---|
| Morales Freyre Sergio D | $45,000 | None Available | |
| Flores Residential Llc | -- | None Available | |
| Flores Rafael | $25,000 | Stewart Title |
Source: Public Records
Mortgage History
| Date | Status | Borrower | Loan Amount |
|---|---|---|---|
| Previous Owner | Flores Rafael | $76,427 |
Source: Public Records
Tax History
| Year | Tax Paid | Tax Assessment Tax Assessment Total Assessment is a certain percentage of the fair market value that is determined by local assessors to be the total taxable value of land and additions on the property. | Land | Improvement |
|---|---|---|---|---|
| 2025 | $766 | $9,138 | $0 | $0 |
| 2024 | $413 | $9,110 | $0 | $0 |
| 2023 | $413 | $9,110 | $0 | $0 |
| 2022 | $618 | $7,340 | $2,480 | $4,860 |
| 2021 | $604 | $7,550 | $2,550 | $5,000 |
| 2020 | $548 | $13,020 | $2,390 | $10,630 |
| 2019 | $547 | $12,940 | $2,380 | $10,560 |
| 2018 | $340 | $4,020 | $1,370 | $2,650 |
| 2017 | $335 | $19,520 | $6,650 | $12,870 |
| 2015 | $123 | $19,560 | $6,150 | $13,410 |
| 2014 | $123 | $18,590 | $6,150 | $12,440 |
| 2013 | $123 | $12,430 | $6,150 | $6,280 |
Source: Public Records
Map
Nearby Homes
- 510 N 4th St
- 518 N 4th St
- 501 N 4th St Unit A,B,C,D
- 777 N 4th St
- 323 N 4th St
- 611 N 2nd St
- 704 N 4th St
- 510 Pine St
- 523 Chestnut St
- 525 Jackson St
- 317 N Division Ave
- 717 Elm St
- 0 W Main St
- 609 N Division Ave Unit A & B
- 414 Mckinley St
- 213 Jefferson St
- 210 S 4th St
- 324 Platte St
- 303 S 3rd St
- 303 S 2nd St