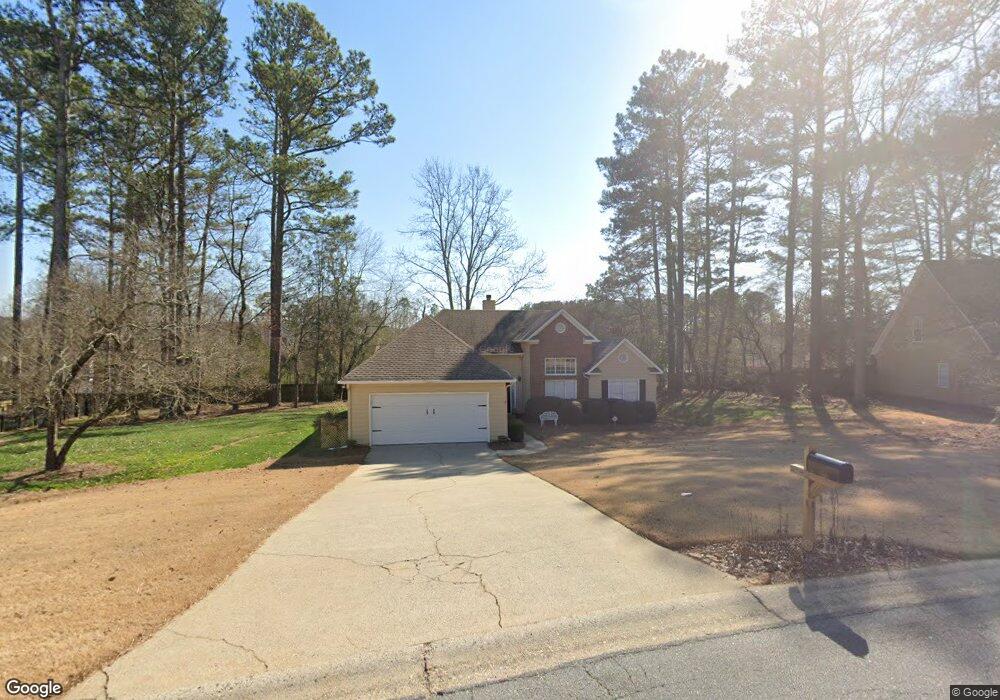
3220 Bethwicke Dr Cumming, GA 30040
Estimated Value: $439,000 - $468,000
3
Beds
2
Baths
1,894
Sq Ft
$238/Sq Ft
Est. Value
About This Home
This home is located at 3220 Bethwicke Dr, Cumming, GA 30040 and is currently estimated at $451,311, approximately $238 per square foot. 3220 Bethwicke Dr is a home located in Forsyth County with nearby schools including Sawnee Elementary School, Hendricks Middle School, and West Forsyth High School.
Ownership History
Date
Name
Owned For
Owner Type
Purchase Details
Closed on
Dec 20, 2005
Sold by
Mann Scott B
Bought by
Jones Joan A
Current Estimated Value
Home Financials for this Owner
Home Financials are based on the most recent Mortgage that was taken out on this home.
Original Mortgage
$141,598
Outstanding Balance
$49,588
Interest Rate
6.29%
Mortgage Type
New Conventional
Estimated Equity
$401,723
Purchase Details
Closed on
May 31, 2000
Sold by
Konrad James J and Konrad Marilyn T
Bought by
Mann Scott B
Home Financials for this Owner
Home Financials are based on the most recent Mortgage that was taken out on this home.
Original Mortgage
$147,250
Interest Rate
8.38%
Mortgage Type
New Conventional
Purchase Details
Closed on
Mar 24, 1994
Sold by
Mccar Devel Corp
Bought by
Konrad James Marilyn
Home Financials for this Owner
Home Financials are based on the most recent Mortgage that was taken out on this home.
Original Mortgage
$88,500
Interest Rate
7.26%
Create a Home Valuation Report for This Property
The Home Valuation Report is an in-depth analysis detailing your home's value as well as a comparison with similar homes in the area
Home Values in the Area
Average Home Value in this Area
Purchase History
| Date | Buyer | Sale Price | Title Company |
|---|---|---|---|
| Jones Joan A | $203,000 | -- | |
| Mann Scott B | $155,000 | -- | |
| Konrad James Marilyn | $118,500 | -- |
Source: Public Records
Mortgage History
| Date | Status | Borrower | Loan Amount |
|---|---|---|---|
| Open | Jones Joan A | $141,598 | |
| Previous Owner | Mann Scott B | $147,250 | |
| Previous Owner | Konrad James Marilyn | $88,500 |
Source: Public Records
Tax History Compared to Growth
Tax History
| Year | Tax Paid | Tax Assessment Tax Assessment Total Assessment is a certain percentage of the fair market value that is determined by local assessors to be the total taxable value of land and additions on the property. | Land | Improvement |
|---|---|---|---|---|
| 2025 | $434 | $158,544 | $56,000 | $102,544 |
| 2024 | $434 | $146,584 | $52,000 | $94,584 |
| 2023 | $348 | $153,176 | $52,000 | $101,176 |
| 2022 | $446 | $106,068 | $32,000 | $74,068 |
| 2021 | $429 | $106,068 | $32,000 | $74,068 |
| 2020 | $424 | $100,248 | $32,000 | $68,248 |
| 2019 | $425 | $97,752 | $30,000 | $67,752 |
| 2018 | $424 | $82,976 | $30,000 | $52,976 |
| 2017 | $433 | $83,964 | $28,000 | $55,964 |
| 2016 | $415 | $70,844 | $18,000 | $52,844 |
| 2015 | $415 | $70,844 | $18,000 | $52,844 |
| 2014 | $377 | $63,228 | $18,000 | $45,228 |
Source: Public Records
Map
Nearby Homes
- 3310 Valleyway Rd
- 3560 Rosewicke Dr
- 3505 Knobcone Dr
- 2710 Laurel Gate Ln
- 2405 Boxwalking Ct
- 3725 Downing Dr
- 2910 Bishopstone Way
- 2425 Barley Crest Pass
- 3826 Stagecoach Ln
- 5225 Southern Hills Ln
- 2455 Westlington Cir
- 2330 Cheatham Creek Ct
- 2810 Brookfield Cir
- 3305 Cove Creek Ln
- 5135 Laurel Park Ln
- 5130 Laurel Park Ln
- 2820 Elderberry Ln
- 3230 Bethwicke Dr Unit 1
- 3210 Bethwicke Dr
- 3435 Rosewicke Dr Unit 31
- 3435 Rosewicke Dr
- 3445 Rosewicke Dr
- 0 Rosewicke Dr Unit 7426629
- 0 Rosewicke Dr Unit 7410506
- 0 Rosewicke Dr Unit 8482157
- 0 Rosewicke Dr Unit 8460318
- 0 Rosewicke Dr Unit 3130459
- 0 Rosewicke Dr Unit 9006859
- 0 Rosewicke Dr Unit 3186491
- 0 Rosewicke Dr Unit 7266333
- 0 Rosewicke Dr Unit 7312892
- 0 Rosewicke Dr
- 3215 Bethwicke Dr
- 3415 Rosewicke Dr
- 3310 Bethwicke Dr
- 3455 Rosewicke Dr
- 3315 Elizabeth Ct