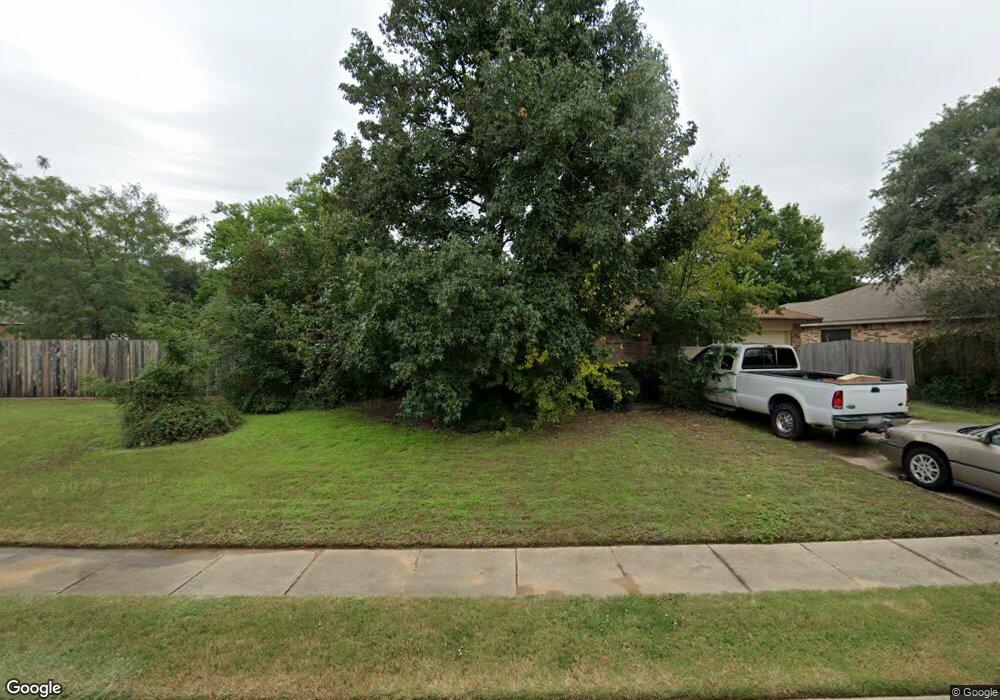
3220 Crystal Springs Bedford, TX 76021
Estimated Value: $373,656 - $426,000
3
Beds
2
Baths
1,796
Sq Ft
$220/Sq Ft
Est. Value
About This Home
This home is located at 3220 Crystal Springs, Bedford, TX 76021 and is currently estimated at $394,414, approximately $219 per square foot. 3220 Crystal Springs is a home located in Tarrant County with nearby schools including Meadow Creek Elementary School, Harwood Junior High School, and Trinity High School.
Ownership History
Date
Name
Owned For
Owner Type
Purchase Details
Closed on
Mar 17, 2002
Sold by
Williams Steven T
Bought by
Mccorkle J Dale and Morton Mccorkle Judith O
Current Estimated Value
Home Financials for this Owner
Home Financials are based on the most recent Mortgage that was taken out on this home.
Original Mortgage
$104,000
Outstanding Balance
$42,740
Interest Rate
6.83%
Mortgage Type
Purchase Money Mortgage
Estimated Equity
$351,674
Purchase Details
Closed on
Dec 15, 2000
Sold by
Helwig Tami L
Bought by
Williams Steven T
Home Financials for this Owner
Home Financials are based on the most recent Mortgage that was taken out on this home.
Original Mortgage
$82,450
Interest Rate
7.8%
Mortgage Type
Purchase Money Mortgage
Purchase Details
Closed on
Apr 2, 1997
Sold by
Alford Douglas
Bought by
Helwig Tami
Create a Home Valuation Report for This Property
The Home Valuation Report is an in-depth analysis detailing your home's value as well as a comparison with similar homes in the area
Home Values in the Area
Average Home Value in this Area
Purchase History
| Date | Buyer | Sale Price | Title Company |
|---|---|---|---|
| Mccorkle J Dale | -- | -- | |
| Williams Steven T | -- | Stewart Title | |
| Helwig Tami | -- | -- |
Source: Public Records
Mortgage History
| Date | Status | Borrower | Loan Amount |
|---|---|---|---|
| Open | Mccorkle J Dale | $104,000 | |
| Previous Owner | Williams Steven T | $82,450 |
Source: Public Records
Tax History Compared to Growth
Tax History
| Year | Tax Paid | Tax Assessment Tax Assessment Total Assessment is a certain percentage of the fair market value that is determined by local assessors to be the total taxable value of land and additions on the property. | Land | Improvement |
|---|---|---|---|---|
| 2025 | $2,173 | $377,562 | $70,000 | $307,562 |
| 2024 | $2,173 | $377,562 | $70,000 | $307,562 |
| 2023 | $6,073 | $363,513 | $55,000 | $308,513 |
| 2022 | $6,287 | $287,852 | $55,000 | $232,852 |
| 2021 | $6,493 | $275,661 | $55,000 | $220,661 |
| 2020 | $6,080 | $255,705 | $55,000 | $200,705 |
| 2019 | $6,084 | $257,337 | $55,000 | $202,337 |
| 2018 | $3,653 | $227,670 | $55,000 | $172,670 |
| 2017 | $5,187 | $214,422 | $22,000 | $192,422 |
| 2016 | $4,730 | $195,523 | $22,000 | $173,523 |
| 2015 | $3,892 | $155,000 | $22,000 | $133,000 |
| 2014 | $3,892 | $155,000 | $22,000 | $133,000 |
Source: Public Records
Map
Nearby Homes
- 3213 Vintage Way
- 3209 Misty Ct
- 3428 Pembroke Place
- 3104 Emerald St
- 3205 Princess St
- 3100 Emerald St
- 3917 Autumn Ln
- 3304 Paint Brush Ln
- 2908 Weslyan Oak St
- 3001 Glenwood Ct
- 3932 Cedar Ridge Dr
- 3209 Rustic Woods Dr
- 3708 Harwood Rd
- 3024 Pecan Cir
- 3112 Hazlewood Ct
- 3201 Oleander Ct
- 3409 Crescent Ct
- 4001 Fairmont Ct
- 3405 Scenic Hills Dr
- 1229 N Industrial Blvd
- 3216 Crystal Springs
- 3521 Ridge Haven Cir
- 3517 Ridge Haven Cir
- 3213 Crystal Springs
- 3217 Crystal Springs
- 3209 Crystal Springs
- 3401 Summer Hill
- 3212 Crystal Springs
- 3221 Crystal Springs
- 3513 Ridge Haven Cir
- 3205 Crystal Springs
- 3405 Summer Hill
- 3208 Crystal Springs
- 3201 Crystal Springs
- 3208 Crystal Springs
- 3225 Crystal Springs
- 3220 Vintage Way
- 3216 Vintage Way
- 3509 Ridge Haven Cir
- 3409 Summer Hill