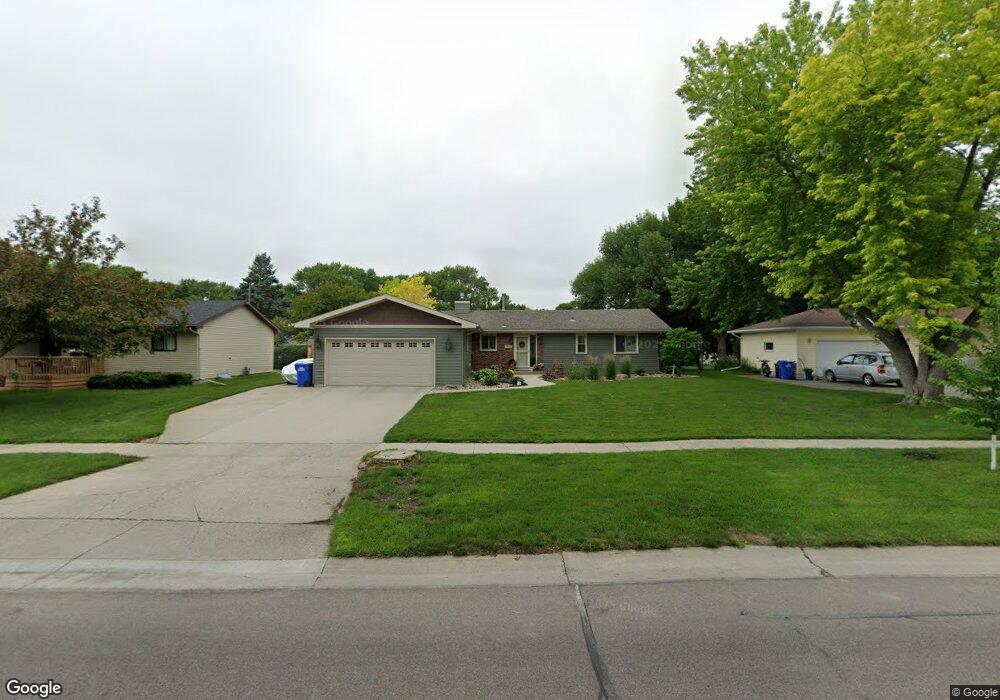
3220 Elm St N Fargo, ND 58102
Trollwood NeighborhoodEstimated Value: $387,000 - $441,000
5
Beds
3
Baths
3,052
Sq Ft
$136/Sq Ft
Est. Value
About This Home
This home is located at 3220 Elm St N, Fargo, ND 58102 and is currently estimated at $414,044, approximately $135 per square foot. 3220 Elm St N is a home located in Cass County with nearby schools including Longfellow Elementary School, Ben Franklin Middle School, and North High School.
Ownership History
Date
Name
Owned For
Owner Type
Purchase Details
Closed on
Oct 27, 2017
Sold by
Jarvis Paul J and Jarvis Ann L
Bought by
Sandman Cindy L and Sandman Mark A
Current Estimated Value
Home Financials for this Owner
Home Financials are based on the most recent Mortgage that was taken out on this home.
Original Mortgage
$207,800
Outstanding Balance
$173,803
Interest Rate
3.78%
Mortgage Type
New Conventional
Estimated Equity
$240,241
Purchase Details
Closed on
Apr 23, 2009
Sold by
Shaw Robert B and Shaw Kathryn C
Bought by
Jarvis Paul J and Jarvis Ann L
Home Financials for this Owner
Home Financials are based on the most recent Mortgage that was taken out on this home.
Original Mortgage
$143,100
Interest Rate
5.05%
Mortgage Type
New Conventional
Create a Home Valuation Report for This Property
The Home Valuation Report is an in-depth analysis detailing your home's value as well as a comparison with similar homes in the area
Home Values in the Area
Average Home Value in this Area
Purchase History
| Date | Buyer | Sale Price | Title Company |
|---|---|---|---|
| Sandman Cindy L | $315,000 | Title Co | |
| Jarvis Paul J | -- | -- |
Source: Public Records
Mortgage History
| Date | Status | Borrower | Loan Amount |
|---|---|---|---|
| Open | Sandman Cindy L | $207,800 | |
| Previous Owner | Jarvis Paul J | $143,100 |
Source: Public Records
Tax History Compared to Growth
Tax History
| Year | Tax Paid | Tax Assessment Tax Assessment Total Assessment is a certain percentage of the fair market value that is determined by local assessors to be the total taxable value of land and additions on the property. | Land | Improvement |
|---|---|---|---|---|
| 2024 | $4,578 | $177,550 | $40,800 | $136,750 |
| 2023 | $4,915 | $172,400 | $40,800 | $131,600 |
| 2022 | $4,452 | $152,550 | $40,800 | $111,750 |
| 2021 | $3,829 | $138,700 | $40,800 | $97,900 |
| 2020 | $3,854 | $138,700 | $40,800 | $97,900 |
| 2019 | $3,858 | $138,700 | $25,500 | $113,200 |
| 2018 | $3,473 | $125,750 | $25,500 | $100,250 |
| 2017 | $3,226 | $117,500 | $25,500 | $92,000 |
| 2016 | $2,724 | $106,800 | $25,500 | $81,300 |
| 2015 | $2,892 | $106,800 | $17,350 | $89,450 |
| 2014 | $2,882 | $104,000 | $17,350 | $86,650 |
| 2013 | $2,757 | $99,050 | $17,350 | $81,700 |
Source: Public Records
Map
Nearby Homes
- 108 32nd Ave N
- 3217 Cherry Ln N
- 3306 2nd St N Unit D26
- 21 35th Ave NE
- 2937 Edgewood Dr N
- 2925 Edgewood Dr N
- 2926 Edgewood Dr N
- 3531 1st St N
- 2939 Maple St N
- 3513 Par St N
- 2902 3rd St N
- 87 28th Ave N
- 3667 Evergreen Rd N
- 2807 Edgewood Dr N
- 501 Forest Ave N Unit C
- 101 27th Ave N
- 801 32nd Ave N Unit A102
- 3129 8th St N
- 3113 8th St N
- 310 27th Ave N