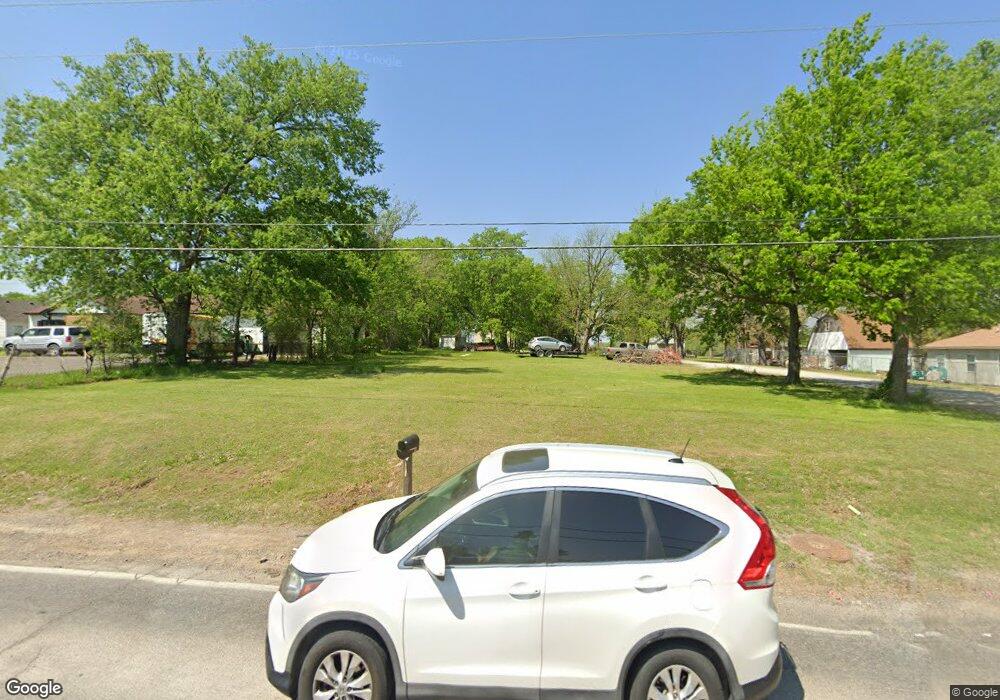
3220 S 113th West Ave Sand Springs, OK 74063
Prattville NeighborhoodEstimated Value: $51,000 - $184,000
--
Bed
1
Bath
1,152
Sq Ft
$102/Sq Ft
Est. Value
About This Home
This home is located at 3220 S 113th West Ave, Sand Springs, OK 74063 and is currently estimated at $117,500, approximately $101 per square foot. 3220 S 113th West Ave is a home located in Tulsa County with nearby schools including Pratt Elementary School, Clyde Boyd Middle School, and Charles Page High School.
Ownership History
Date
Name
Owned For
Owner Type
Purchase Details
Closed on
May 10, 2024
Sold by
Immel Lagena
Bought by
Ramezani Hamid R and Ramezani Annette
Current Estimated Value
Purchase Details
Closed on
Apr 5, 2022
Sold by
Luttrell Jeremy A and Luttrell Tonya
Bought by
City Of Sand Springs
Purchase Details
Closed on
Mar 28, 2022
Sold by
Lagena Immel
Bought by
City Of Sand Springs
Purchase Details
Closed on
Mar 1, 2021
Sold by
Immel Lagena
Bought by
Immel Lagena and Mclemore Krissy
Purchase Details
Closed on
Feb 3, 2000
Sold by
Immel Lagena and Immel Krissy
Bought by
Immel Lagena
Home Financials for this Owner
Home Financials are based on the most recent Mortgage that was taken out on this home.
Original Mortgage
$54,500
Interest Rate
8.23%
Mortgage Type
Purchase Money Mortgage
Purchase Details
Closed on
Jul 31, 1998
Sold by
Collins Conrad Doyle and Collins Ruth Ann
Bought by
Immel Lagena and Immel Krissy
Create a Home Valuation Report for This Property
The Home Valuation Report is an in-depth analysis detailing your home's value as well as a comparison with similar homes in the area
Home Values in the Area
Average Home Value in this Area
Purchase History
| Date | Buyer | Sale Price | Title Company |
|---|---|---|---|
| Ramezani Hamid R | $50,000 | None Listed On Document | |
| City Of Sand Springs | -- | None Listed On Document | |
| City Of Sand Springs | -- | None Listed On Document | |
| Immel Lagena | -- | None Listed On Document | |
| Immel Lagena | -- | Tulsa Abstract & Title Co | |
| Immel Lagena | $45,000 | Tulsa Abstract & Title Compa |
Source: Public Records
Mortgage History
| Date | Status | Borrower | Loan Amount |
|---|---|---|---|
| Previous Owner | Immel Lagena | $54,500 |
Source: Public Records
Tax History Compared to Growth
Tax History
| Year | Tax Paid | Tax Assessment Tax Assessment Total Assessment is a certain percentage of the fair market value that is determined by local assessors to be the total taxable value of land and additions on the property. | Land | Improvement |
|---|---|---|---|---|
| 2024 | $275 | $2,181 | $2,181 | -- |
| 2023 | $275 | $2,181 | $2,181 | $0 |
| 2022 | $287 | $2,330 | $2,330 | $0 |
| 2021 | $286 | $2,279 | $2,279 | $0 |
| 2020 | $282 | $2,171 | $2,171 | $0 |
| 2019 | $261 | $2,067 | $2,067 | $0 |
| 2018 | $242 | $1,969 | $1,969 | $0 |
| 2017 | $848 | $7,040 | $1,969 | $5,071 |
| 2016 | $866 | $7,040 | $1,969 | $5,071 |
| 2015 | $878 | $7,040 | $1,969 | $5,071 |
| 2014 | $886 | $7,040 | $1,969 | $5,071 |
Source: Public Records
Map
Nearby Homes
- 3218 S 113th West Ave
- Ashville AE Plan at Rivercrest - Prattville
- Brenda MG Plan at Rivercrest - Prattville
- Lee II Plan at Rivercrest - Prattville
- Ashville Plan at Rivercrest - Prattville
- Brenda Plan at Rivercrest - Prattville
- Walker ll Plan at Rivercrest - Prattville
- Walker FH Plan at Rivercrest - Prattville
- Oak Plan at Rivercrest - Prattville
- Dorsey IV Plan at Rivercrest - Prattville
- Washington Plan at Rivercrest - Prattville
- Dorsey Farm House Plan at Rivercrest - Prattville
- Ridgway III Plan at Rivercrest - Prattville
- Dorsey V Plan at Rivercrest - Prattville
- 0 S Linwood Dr Unit 2535831
- 10 E 31st Place
- 0 S Walnut Creek Place
- 3210 Summit Blvd
- 3306 Springtree Ln
- 302 Skylane Ct
- 3220 S 113th West Ave
- 3224 S 113th West Ave
- 3218 S 113th Ave W
- 3216 S 113th West Ave
- 3226 S 113th West Ave
- 3222 S 113th West Ave
- 704 W 53rd Place
- 3300 S 113th West Ave
- 3214 S 113th West Ave
- 3301 S 113th Ave W Unit 64
- 3301 S 113th Ave W Unit 10
- 3301 S 113th Ave W
- 3302 S 113th West Ave
- 2 E 32nd Place
- 3212 S 113th West Ave
- 4 E 32nd Place
- 3301 S 113th West Ave
- 6 E 32nd Place
- 6 E 32nd Place
- 3210 S 113th West Ave