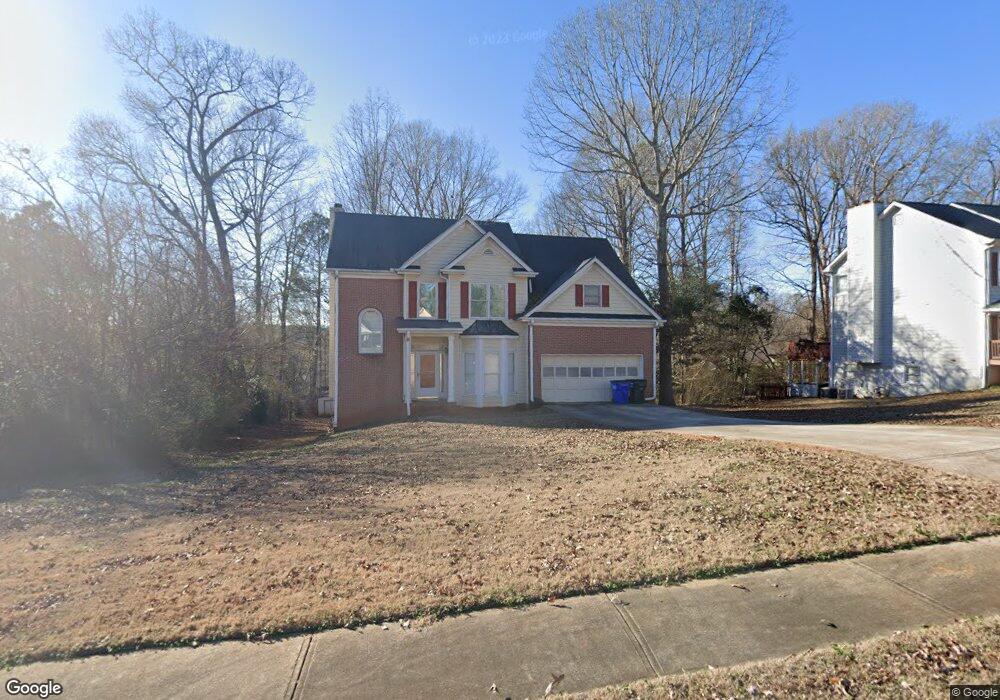
3220 Scenic Brook Dr SW Conyers, GA 30094
Estimated Value: $322,000 - $371,105
4
Beds
4
Baths
2,902
Sq Ft
$121/Sq Ft
Est. Value
About This Home
This home is located at 3220 Scenic Brook Dr SW, Conyers, GA 30094 and is currently estimated at $351,026, approximately $120 per square foot. 3220 Scenic Brook Dr SW is a home located in Rockdale County with nearby schools including Shoal Creek Elementary School, Gen. Ray Davis Middle School, and Heritage High School.
Ownership History
Date
Name
Owned For
Owner Type
Purchase Details
Closed on
Aug 19, 2016
Sold by
Federal Natl Mtg Assn Fnma
Bought by
Bryant Dwayne
Current Estimated Value
Home Financials for this Owner
Home Financials are based on the most recent Mortgage that was taken out on this home.
Original Mortgage
$141,535
Outstanding Balance
$116,496
Interest Rate
4.5%
Mortgage Type
FHA
Estimated Equity
$234,530
Purchase Details
Closed on
Nov 5, 2014
Sold by
Harper John A
Bought by
Federal National Mtg Associati
Purchase Details
Closed on
Mar 15, 2005
Sold by
Cahill James E and Cahill Marie
Bought by
Harper John A
Home Financials for this Owner
Home Financials are based on the most recent Mortgage that was taken out on this home.
Original Mortgage
$183,500
Interest Rate
5.6%
Mortgage Type
New Conventional
Purchase Details
Closed on
May 31, 1996
Sold by
Mathis Bldrs Inc
Bought by
Cahill James E Marie G
Create a Home Valuation Report for This Property
The Home Valuation Report is an in-depth analysis detailing your home's value as well as a comparison with similar homes in the area
Home Values in the Area
Average Home Value in this Area
Purchase History
| Date | Buyer | Sale Price | Title Company |
|---|---|---|---|
| Bryant Dwayne | $132,000 | -- | |
| Federal National Mtg Associati | $170,340 | -- | |
| Harper John A | $183,500 | -- | |
| Cahill James E Marie G | $145,000 | -- |
Source: Public Records
Mortgage History
| Date | Status | Borrower | Loan Amount |
|---|---|---|---|
| Open | Bryant Dwayne | $141,535 | |
| Previous Owner | Harper John A | $183,500 | |
| Closed | Cahill James E Marie G | $0 |
Source: Public Records
Tax History Compared to Growth
Tax History
| Year | Tax Paid | Tax Assessment Tax Assessment Total Assessment is a certain percentage of the fair market value that is determined by local assessors to be the total taxable value of land and additions on the property. | Land | Improvement |
|---|---|---|---|---|
| 2024 | $3,357 | $136,360 | $19,120 | $117,240 |
| 2023 | $3,048 | $128,600 | $26,360 | $102,240 |
| 2022 | $2,385 | $102,800 | $21,520 | $81,280 |
| 2021 | $1,988 | $82,400 | $15,440 | $66,960 |
| 2020 | $1,531 | $65,440 | $9,640 | $55,800 |
| 2019 | $2,955 | $65,440 | $9,640 | $55,800 |
| 2018 | $2,968 | $65,440 | $9,640 | $55,800 |
| 2017 | $2,087 | $45,480 | $7,080 | $38,400 |
| 2016 | $1,788 | $38,920 | $7,080 | $31,840 |
| 2015 | $1,790 | $38,920 | $7,080 | $31,840 |
| 2014 | $618 | $38,040 | $6,200 | $31,840 |
| 2013 | -- | $55,960 | $12,000 | $43,960 |
Source: Public Records
Map
Nearby Homes
- 3190 Water Brook Dr SW
- 1048 Falls Brooke Dr
- 1401 Stone Bridge Ln SW
- 3906 Rosebay Way SW
- 981 Havenridge Dr SW
- 2923 Hurst Rd SW
- 1240 Falls Creek Ct
- 3650 River Rock Rd
- 3016 Heights Ave SW
- 4058 Rosebay Way SW
- 1103 W Adrian Cir SW
- 7225 Bedrock Cir
- 3208 Highpoint Way SW
- 1092 W Adrian Cir SW
- 1087 W Adrian Cir SW
- 3011 Flat Shoals Rd SW
- 1084 W Adrian Cir SW
- 2887 Bridle Creek Dr SW
- 7207 Gladstone Cir
- 1221 Rhodes Walk SW
- 3210 Scenic Brook Dr SW
- 3332 Scenic Ct
- 3230 Scenic Brook Dr SW
- 3240 Scenic Brook Dr SW
- 1410 Scenic Brook Trail SW Unit 7
- 3340 Scenic Ct
- 3221 Scenic Brook Dr SW
- 3211 Scenic Brook Dr SW
- 3231 Scenic Brook Dr SW Unit 4
- 1420 Scenic Brook Trail SW
- 3201 Scenic Brook Dr SW Unit 4
- 3241 Scenic Brook Dr SW
- 1460 Scenic Brook Trail SW Unit 7
- 1430 Scenic Brook Trail SW
- 3324 Scenic Ct Unit 7
- 3110 Scenic Brook Dr SW Unit 4
- 3475 Scenic Ct
- 1411 Scenic Brook Trail SW Unit 7
- 3251 Scenic Brook Dr SW Unit 4
- 3111 Scenic Brook Dr SW