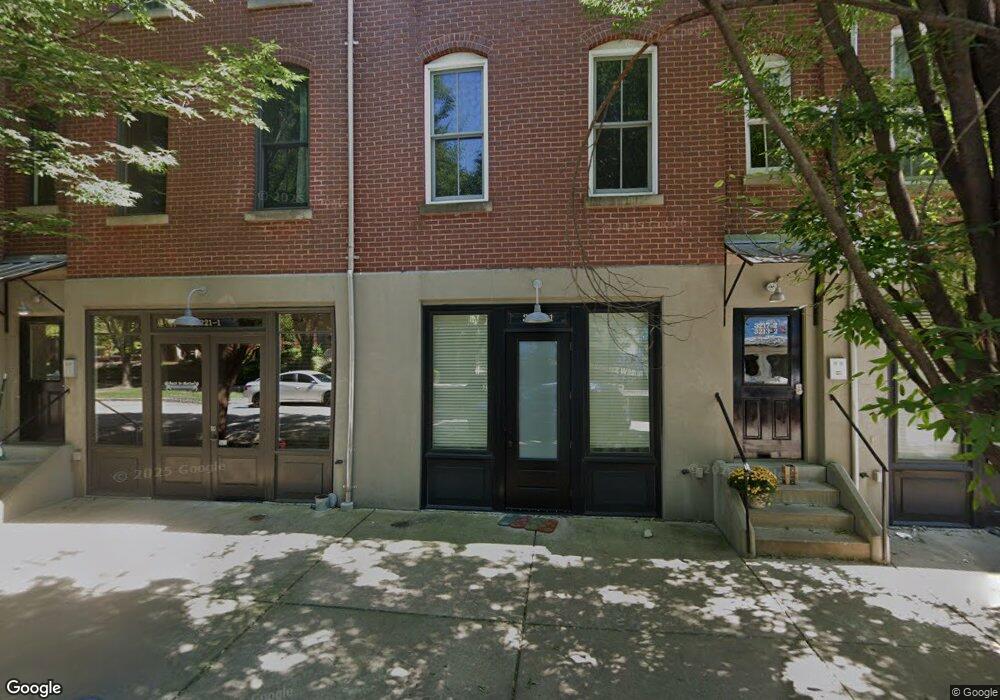
3221 Domain St Saint Charles, MO 63301
New Town Neighborhood
--
Bed
--
Bath
2,196
Sq Ft
1,307
Sq Ft Lot
About This Home
This home is located at 3221 Domain St, Saint Charles, MO 63301. 3221 Domain St is a home located in St. Charles County with nearby schools including Discovery Elementary School, Orchard Farm Elementary School, and Orchard Farm Middle School.
Ownership History
Date
Name
Owned For
Owner Type
Purchase Details
Closed on
Nov 3, 2020
Sold by
K & A Investments Llc
Bought by
Cre Solutions Llc
Home Financials for this Owner
Home Financials are based on the most recent Mortgage that was taken out on this home.
Original Mortgage
$177,600
Outstanding Balance
$158,039
Interest Rate
2.8%
Mortgage Type
New Conventional
Purchase Details
Closed on
May 31, 2013
Sold by
Burrls Robert K and Burrls Anne M
Bought by
K & A Investments Llc
Purchase Details
Closed on
Nov 10, 2010
Sold by
K & A Investments Llc
Bought by
Burris Robert K and Burris Anne M
Purchase Details
Closed on
Oct 31, 2007
Sold by
Burris Robert K and Burris Anne M
Bought by
K & A Investments Llc
Purchase Details
Closed on
Oct 3, 2007
Sold by
K & A Investments Llc
Bought by
Burris Robert K and Burris Anne M
Purchase Details
Closed on
Oct 30, 2006
Sold by
Whittaker Builders Inc
Bought by
K & A Investments Llc
Home Financials for this Owner
Home Financials are based on the most recent Mortgage that was taken out on this home.
Original Mortgage
$211,948
Interest Rate
6.37%
Mortgage Type
Commercial
Create a Home Valuation Report for This Property
The Home Valuation Report is an in-depth analysis detailing your home's value as well as a comparison with similar homes in the area
Home Values in the Area
Average Home Value in this Area
Purchase History
| Date | Buyer | Sale Price | Title Company |
|---|---|---|---|
| Cre Solutions Llc | -- | True Title Company Llc | |
| Cre Solutions Llc | $236,208 | True Title | |
| K & A Investments Llc | -- | None Available | |
| Burris Robert K | -- | None Available | |
| K & A Investments Llc | -- | Lacw | |
| Burris Robert K | -- | Commonwealth | |
| K & A Investments Llc | -- | None Available |
Source: Public Records
Mortgage History
| Date | Status | Borrower | Loan Amount |
|---|---|---|---|
| Open | Cre Solutions Llc | $177,600 | |
| Closed | Cre Solutions Llc | $177,600 | |
| Previous Owner | K & A Investments Llc | $211,948 |
Source: Public Records
Tax History Compared to Growth
Tax History
| Year | Tax Paid | Tax Assessment Tax Assessment Total Assessment is a certain percentage of the fair market value that is determined by local assessors to be the total taxable value of land and additions on the property. | Land | Improvement |
|---|---|---|---|---|
| 2025 | $4,472 | $67,283 | -- | -- |
| 2023 | $4,616 | $64,296 | $0 | $0 |
| 2022 | $4,250 | $57,011 | $0 | $0 |
| 2021 | $4,255 | $57,011 | $0 | $0 |
| 2020 | $4,312 | $57,172 | $0 | $0 |
| 2019 | $3,932 | $57,172 | $0 | $0 |
| 2018 | $3,779 | $52,514 | $0 | $0 |
| 2017 | $3,726 | $52,514 | $0 | $0 |
| 2016 | $3,710 | $50,935 | $0 | $0 |
| 2015 | $3,737 | $50,935 | $0 | $0 |
| 2014 | $4,147 | $55,957 | $0 | $0 |
Source: Public Records
Map
Nearby Homes
- 3237 Domain St
- 3610 Arpent St
- 3225 Canal St
- 0 Magnolia (New Town) Unit MAR25029306
- 3529 New Town Lake Dr
- 0 Elderberry (New Town) Unit MAR25022101
- 0 Hawthorn (New Town) Unit MIS25029345
- 0 Mulberry (New Town) Unit MIS25022470
- 0 Arden 4 Br (New Town) Unit MIS24067816
- 0 Arden 3 Br (New Town) Unit MIS24066978
- 0 Linden (New Town) Unit MIS25029639
- 177 Arpent St
- 3524 Galt House Dr
- 3312 Canal St
- 3520 Galt House Dr
- 3312 Shutten St
- 237 E Arpent Way
- 3265 S Civic Green Way
- 3575 Hempstead St
- 177 Arpent Alley
- 3217 Domain St Unit 2
- 3213 Domain St Unit 2
- 3213 Domain St
- 3229 Domain St Unit 1
- 3229 Domain St Unit 3
- 3205 Domain St
- 3201 Domain St Unit 2
- 3241 Domain St
- 3208 Domain St
- 3245 Domain St
- 3204 Domain St
- 3220 Domain St
- 3224 Domain St
- 3578 Arpent St
- 3228 Domain St
- 3200 Domain St
- 3574 Arpent St
- 3232 Domain St
- 3249 Domain St Unit 1
- 3249 Domain St