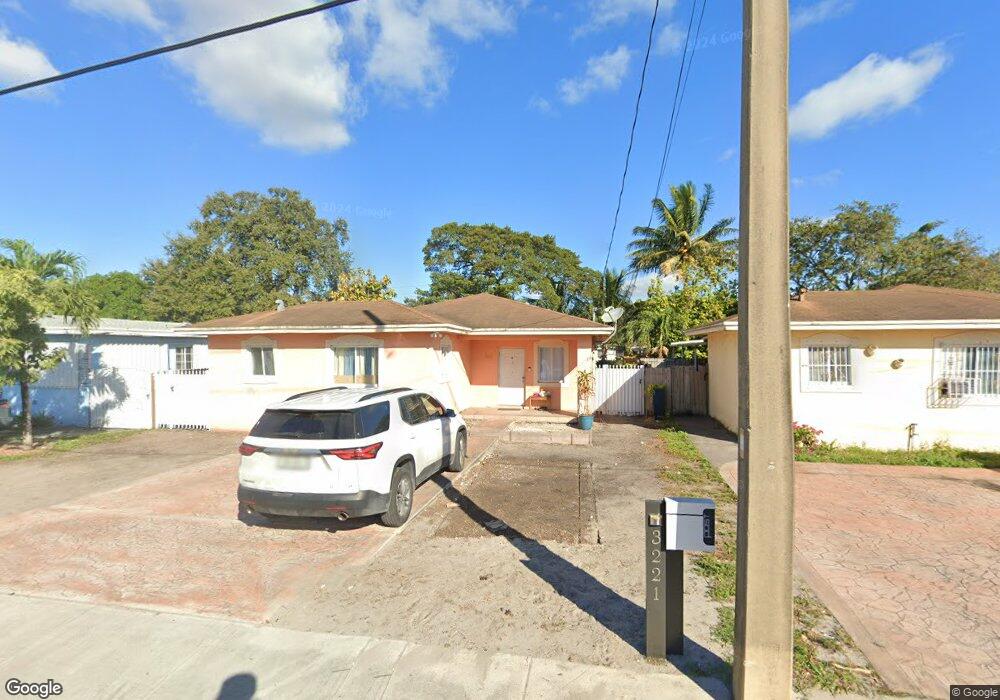
3221 NW 135th St Opa Locka, FL 33054
Estimated Value: $431,000 - $467,000
3
Beds
2
Baths
1,454
Sq Ft
$311/Sq Ft
Est. Value
About This Home
This home is located at 3221 NW 135th St, Opa Locka, FL 33054 and is currently estimated at $452,556, approximately $311 per square foot. 3221 NW 135th St is a home located in Miami-Dade County with nearby schools including Dr. Robert B. Ingram/Opa-Locka Elementary School, North Dade Middle School, and Miami Central Senior High School.
Ownership History
Date
Name
Owned For
Owner Type
Purchase Details
Closed on
Mar 13, 2024
Sold by
Pulido Juana Inez and Herrera Noel Bejega
Bought by
Salazar Alvarez Yalina
Current Estimated Value
Home Financials for this Owner
Home Financials are based on the most recent Mortgage that was taken out on this home.
Original Mortgage
$427,121
Outstanding Balance
$420,017
Interest Rate
6.63%
Mortgage Type
FHA
Estimated Equity
$32,539
Purchase Details
Closed on
Jun 13, 2007
Sold by
Vjl Investment Co
Bought by
Luisa Manuel Jose and Montelles Medelia A
Home Financials for this Owner
Home Financials are based on the most recent Mortgage that was taken out on this home.
Original Mortgage
$238,350
Interest Rate
6.5%
Mortgage Type
Unknown
Purchase Details
Closed on
Mar 7, 2006
Sold by
Berman Mikhail
Bought by
Vjl Investment Co
Create a Home Valuation Report for This Property
The Home Valuation Report is an in-depth analysis detailing your home's value as well as a comparison with similar homes in the area
Home Values in the Area
Average Home Value in this Area
Purchase History
| Date | Buyer | Sale Price | Title Company |
|---|---|---|---|
| Salazar Alvarez Yalina | $435,000 | None Listed On Document | |
| Luisa Manuel Jose | $265,000 | The Harrison Title Group Inc | |
| Vjl Investment Co | $120,000 | The Harrison Title Group Inc |
Source: Public Records
Mortgage History
| Date | Status | Borrower | Loan Amount |
|---|---|---|---|
| Open | Salazar Alvarez Yalina | $427,121 | |
| Previous Owner | Luisa Manuel Jose | $238,350 |
Source: Public Records
Tax History Compared to Growth
Tax History
| Year | Tax Paid | Tax Assessment Tax Assessment Total Assessment is a certain percentage of the fair market value that is determined by local assessors to be the total taxable value of land and additions on the property. | Land | Improvement |
|---|---|---|---|---|
| 2025 | $7,072 | $345,564 | $168,750 | $176,814 |
| 2024 | $3,188 | $259,944 | $81,000 | $178,944 |
| 2023 | $3,188 | $152,554 | $0 | $0 |
| 2022 | $3,148 | $148,111 | $0 | $0 |
| 2021 | $3,106 | $143,798 | $0 | $0 |
| 2020 | $3,005 | $141,813 | $0 | $0 |
| 2019 | $2,929 | $138,625 | $0 | $0 |
| 2018 | $2,795 | $136,041 | $0 | $0 |
| 2017 | $2,685 | $133,243 | $0 | $0 |
| 2016 | $2,868 | $130,503 | $0 | $0 |
| 2015 | $2,769 | $129,966 | $0 | $0 |
| 2014 | $2,803 | $132,244 | $0 | $0 |
Source: Public Records
Map
Nearby Homes
- 13380 NW 32nd Ave
- 724 Burlington St
- 3171 NW 133rd St
- 641 Burlington St
- 13425 NW 31st Ave
- 3260 NW 132nd Terrace
- 3040 NW 135th St
- 13265 Alexandria Dr
- 13300 Alexandria Dr
- 2911 NW 135th St
- 13400 Alexandria Dr
- 2924 NW 132nd Terrace
- 1050 Superior St
- 2920 NW 132nd Terrace
- 680 Superior St
- 1116 Superior St
- 341 Aladdin St
- 1130 Rutland St
- 2748 NW 131st St
- 0 NW 27th Ave Unit A11874734
- 3211 NW 135th St
- 3231 NW 135th St
- 3205 NW 135th St
- 0 NW 135th St
- 3251 NW 135th St
- 3201 NW 135th St
- 3230 NW 135th St
- 3261 NW 135th St
- 3250 NW 135th St
- 3220 NW 135th St
- 3265 NW 135th St
- 771 Atlantic Ave
- 3199 NW 135th St
- 779 Atlantic Ave
- 761 Atlantic Ave
- 781 Atlantic Ave
- 3277 NW 135th St
- 13440 NW 32nd Ave
- 791 Atlantic Ave