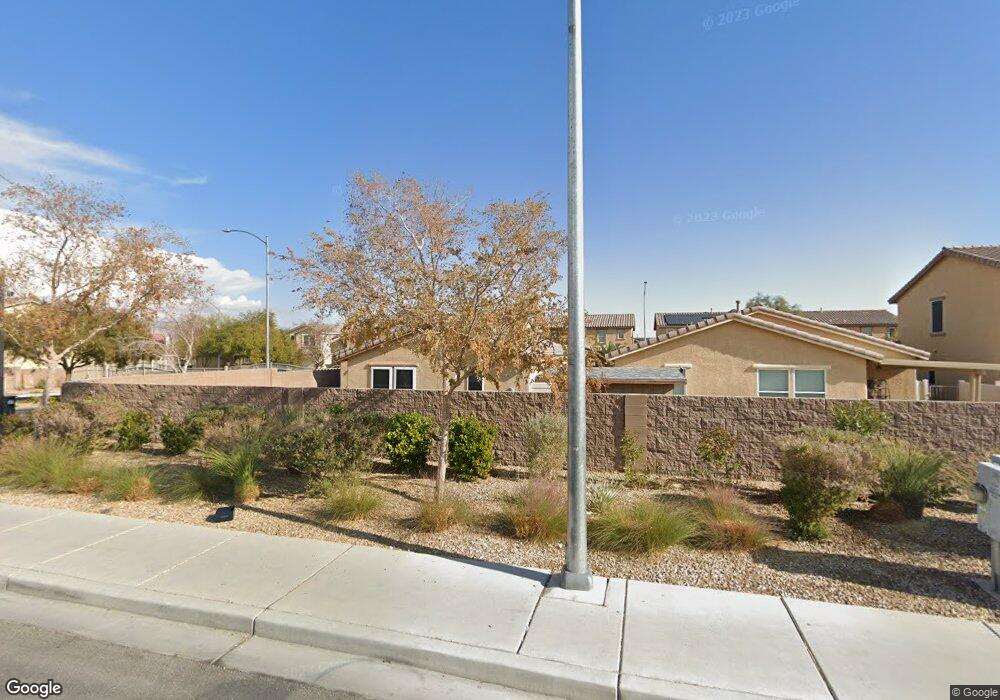
3221 Trinitero St North Las Vegas, NV 89032
Cheyenne NeighborhoodEstimated Value: $374,000 - $397,000
3
Beds
2
Baths
1,282
Sq Ft
$300/Sq Ft
Est. Value
About This Home
This home is located at 3221 Trinitero St, North Las Vegas, NV 89032 and is currently estimated at $384,552, approximately $299 per square foot. 3221 Trinitero St is a home with nearby schools including Richard C. Priest Elementary School, Theron L Swainston Middle School, and Cheyenne High School.
Ownership History
Date
Name
Owned For
Owner Type
Purchase Details
Closed on
May 28, 2013
Sold by
Rai Catherine M
Bought by
Rai Neal S
Current Estimated Value
Home Financials for this Owner
Home Financials are based on the most recent Mortgage that was taken out on this home.
Original Mortgage
$140,741
Outstanding Balance
$99,820
Interest Rate
3.5%
Mortgage Type
FHA
Estimated Equity
$284,732
Purchase Details
Closed on
May 17, 2013
Sold by
Estancia Vegas Llc
Bought by
Rai Neal S
Home Financials for this Owner
Home Financials are based on the most recent Mortgage that was taken out on this home.
Original Mortgage
$140,741
Outstanding Balance
$99,820
Interest Rate
3.5%
Mortgage Type
FHA
Estimated Equity
$284,732
Purchase Details
Closed on
Oct 12, 2009
Sold by
Estancia West Llc
Bought by
Estancia Vegas Llc
Create a Home Valuation Report for This Property
The Home Valuation Report is an in-depth analysis detailing your home's value as well as a comparison with similar homes in the area
Home Values in the Area
Average Home Value in this Area
Purchase History
| Date | Buyer | Sale Price | Title Company |
|---|---|---|---|
| Rai Neal S | -- | First American Title Centra | |
| Rai Neal S | $143,338 | First American Title Centra | |
| Estancia Vegas Llc | -- | Community Title Services Of | |
| Estancia West Llc | -- | Community Title Services Of |
Source: Public Records
Mortgage History
| Date | Status | Borrower | Loan Amount |
|---|---|---|---|
| Open | Rai Neal S | $140,741 |
Source: Public Records
Tax History Compared to Growth
Tax History
| Year | Tax Paid | Tax Assessment Tax Assessment Total Assessment is a certain percentage of the fair market value that is determined by local assessors to be the total taxable value of land and additions on the property. | Land | Improvement |
|---|---|---|---|---|
| 2025 | $2,527 | $99,749 | $26,250 | $73,499 |
| 2024 | $2,340 | $99,749 | $26,250 | $73,499 |
| 2023 | $2,340 | $97,315 | $28,700 | $68,615 |
| 2022 | $2,167 | $86,038 | $23,450 | $62,588 |
| 2021 | $2,007 | $80,492 | $21,350 | $59,142 |
| 2020 | $1,861 | $78,725 | $20,300 | $58,425 |
| 2019 | $1,744 | $73,084 | $15,750 | $57,334 |
| 2018 | $1,664 | $60,831 | $14,000 | $46,831 |
| 2017 | $1,994 | $58,459 | $12,600 | $45,859 |
| 2016 | $1,556 | $48,420 | $10,850 | $37,570 |
| 2015 | $1,552 | $46,245 | $8,750 | $37,495 |
| 2014 | $1,507 | $7,000 | $7,000 | $0 |
Source: Public Records
Map
Nearby Homes
- 3228 Trinitero St
- 0 June Unit 2706697
- 0 June Unit 2692591
- 0 Tamerind St Unit 2685915
- 0 0 Cheyenne & Englestad Unit 1536141
- 0 0 Englestad Cheyenne Unit 1635643
- 1822 Trigger Way
- 1854 Oak Bluffs Ave
- 3355 Clayton St
- 00 Ward
- 0 Clayton Unit 2712913
- 1608 Knoll Heights Ct
- 01 Brooks St
- 3644 Quail Creek Dr
- 3317 Spinet Dr
- 0 W Brooks Ave
- 0 W Mayflower
- 1981 Komodo Dragon Ct
- 410 Rocky Peak Dr Unit 1704
- 0 W Piper Ave
- 3217 Trinitero St
- 3213 Trinitero St
- 3224 Trinitero St
- 3233 Trinitero St
- 3220 Trinitero St
- 3212 Trinitero St
- 3237 Trinitero St
- 3232 Trinitero St
- 3205 Trinitero St
- 3212 Rosetti Way
- 3208 Rosetti Way
- 1729 Ronzard Ave
- 3236 Trinitero St
- 3225 Brautigan Ct
- 3221 Brautigan Ct
- 3220 Rosetti Way
- 3204 Rosetti Way
- 3229 Brautigan Ct
- 1725 Ronzard Ave
- 3217 Brautigan Ct