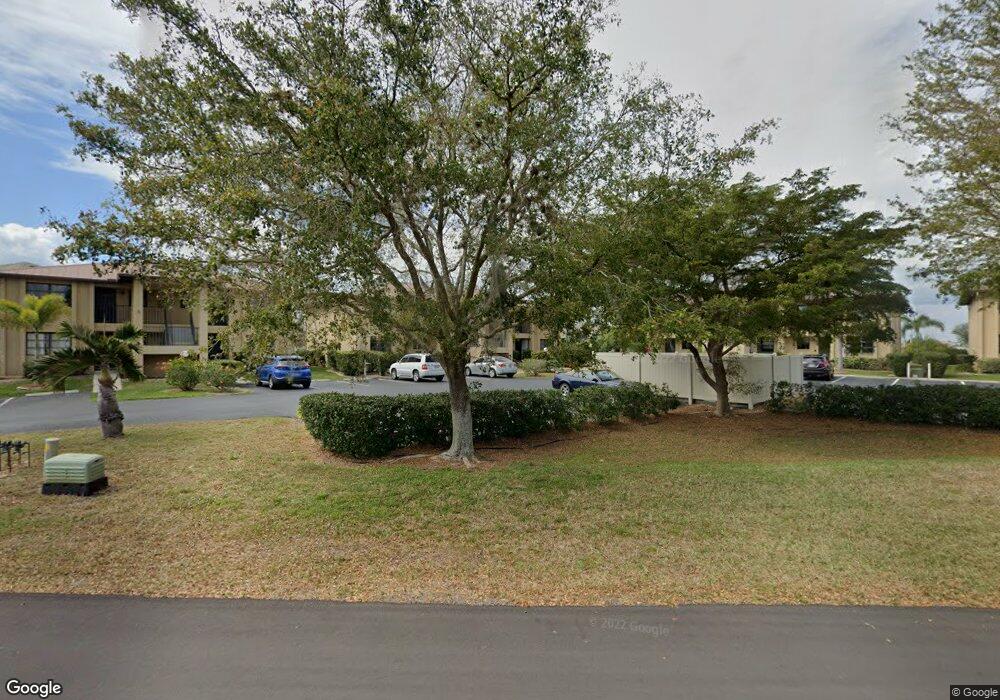
3221 White Ibis Ct Unit A2 Punta Gorda, FL 33950
Punta Gorda Isles NeighborhoodEstimated Value: $156,116 - $207,000
2
Beds
1
Bath
826
Sq Ft
$225/Sq Ft
Est. Value
About This Home
This home is located at 3221 White Ibis Ct Unit A2, Punta Gorda, FL 33950 and is currently estimated at $185,779, approximately $224 per square foot. 3221 White Ibis Ct Unit A2 is a home located in Charlotte County with nearby schools including Sallie Jones Elementary School, Punta Gorda Middle School, and Charlotte High School.
Ownership History
Date
Name
Owned For
Owner Type
Purchase Details
Closed on
Mar 20, 2009
Sold by
Chapman Albert Ray and Lindquist Martha D
Bought by
Smith Donald A and Smith Marianne C
Current Estimated Value
Purchase Details
Closed on
Apr 30, 1999
Sold by
Kooimna Donna M
Bought by
Chapman Albert Ray and Lindquist Martha D
Home Financials for this Owner
Home Financials are based on the most recent Mortgage that was taken out on this home.
Original Mortgage
$60,000
Interest Rate
7%
Purchase Details
Closed on
Nov 5, 1998
Sold by
Dejong Leroy D
Bought by
Kooiman Donna M
Purchase Details
Closed on
Jan 19, 1996
Sold by
Maher Bernard S
Bought by
Dejong Lee D
Home Financials for this Owner
Home Financials are based on the most recent Mortgage that was taken out on this home.
Original Mortgage
$41,400
Interest Rate
7.2%
Purchase Details
Closed on
Mar 28, 1995
Sold by
Mctigue Francis P and Mctigue Marie A
Bought by
Maher Bernard S
Create a Home Valuation Report for This Property
The Home Valuation Report is an in-depth analysis detailing your home's value as well as a comparison with similar homes in the area
Home Values in the Area
Average Home Value in this Area
Purchase History
| Date | Buyer | Sale Price | Title Company |
|---|---|---|---|
| Smith Donald A | -- | Attorney | |
| Smith Donald A | $125,000 | Attorney | |
| Chapman Albert Ray | $69,900 | -- | |
| Kooiman Donna M | -- | -- | |
| Dejong Lee D | $51,900 | -- | |
| Maher Bernard S | -- | -- | |
| Maher Bernard S | $85,000 | -- |
Source: Public Records
Mortgage History
| Date | Status | Borrower | Loan Amount |
|---|---|---|---|
| Previous Owner | Chapman Albert Ray | $60,000 | |
| Previous Owner | Dejong Lee D | $41,400 |
Source: Public Records
Tax History Compared to Growth
Tax History
| Year | Tax Paid | Tax Assessment Tax Assessment Total Assessment is a certain percentage of the fair market value that is determined by local assessors to be the total taxable value of land and additions on the property. | Land | Improvement |
|---|---|---|---|---|
| 2023 | $2,950 | $129,432 | $0 | $0 |
| 2022 | $2,368 | $141,824 | $0 | $141,824 |
| 2021 | $2,227 | $136,910 | $0 | $136,910 |
| 2020 | $1,978 | $123,570 | $0 | $123,570 |
| 2019 | $1,754 | $102,507 | $0 | $102,507 |
| 2018 | $1,581 | $103,911 | $0 | $103,911 |
| 2017 | $1,523 | $104,613 | $0 | $0 |
| 2016 | $1,409 | $66,419 | $0 | $0 |
| 2015 | $1,143 | $60,381 | $0 | $0 |
| 2014 | $1,211 | $64,303 | $0 | $0 |
Source: Public Records
Map
Nearby Homes
- 3221 White Ibis Ct Unit D1
- 3221 White Ibis Ct Unit D2
- 1335 Rock Dove Ct Unit 52
- 1335 Rock Dove Ct Unit 111
- 1349 Aqui Esta Dr Unit 125
- 1359 Aqui Esta Dr
- 3234 Wood Thrush Dr
- 3256 White Ibis Ct Unit 13B
- 1340 Rock Dove Ct Unit 143
- 3314 Wood Thrush Dr Unit 124
- 1336 Aqui Esta Dr
- 1348 Rock Dove Ct Unit C103
- 1301 Aqui Esta Dr
- 261 Aqui Esta Dr
- 1323/1301 Aqui Esta Dr
- 3216 Purple Martin Dr Unit 121
- 3216 Purple Martin Dr Unit 123
- 3216 Purple Martin Dr Unit 122
- 3228 Purple Martin Dr Unit 116
- 1461 Aqui Esta Dr Unit B3
- 3221 White Ibis Ct
- 3221 White Ibis Ct
- 3221 White Ibis Ct Unit D3
- 3221 White Ibis Ct Unit D4
- 3221 White Ibis Ct Unit C6
- 3221 White Ibis Ct Unit C4
- 3221 White Ibis Ct Unit C3
- 3221 White Ibis Ct Unit C5
- 3221 White Ibis Ct Unit C2
- 3221 White Ibis Ct Unit C1
- 3221 White Ibis Ct Unit A1
- 3221 White Ibis Ct Unit A4
- 3221 White Ibis Ct Unit A3
- 3221 White Ibis Ct Unit B4
- 3221 White Ibis Ct Unit B2
- 3221 White Ibis Ct Unit B5
- 3221 White Ibis Ct Unit B6
- 3221 White Ibis Ct Unit B3
- 3245 White Ibis Ct Un 122 Unit 122
- 3245 White Ibis U122 Ct Unit 122