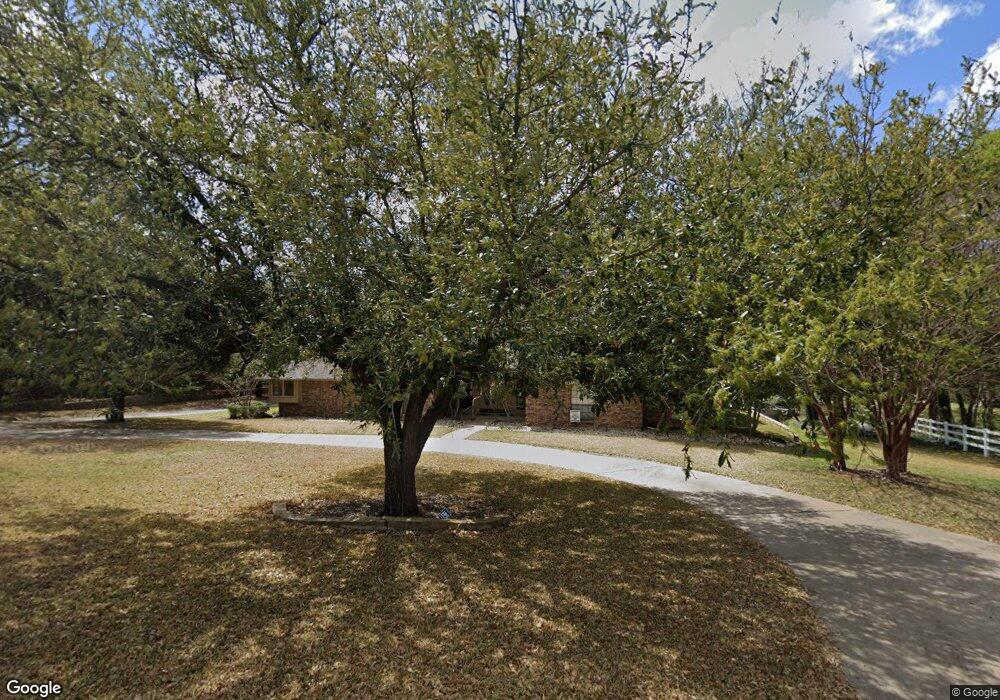
3221 Windridge Ct Midlothian, TX 76065
Estimated Value: $612,190 - $657,000
4
Beds
3
Baths
3,118
Sq Ft
$204/Sq Ft
Est. Value
About This Home
This home is located at 3221 Windridge Ct, Midlothian, TX 76065 and is currently estimated at $634,595, approximately $203 per square foot. 3221 Windridge Ct is a home located in Ellis County with nearby schools including Larue Miller Elementary School and Frank Seale Middle School.
Ownership History
Date
Name
Owned For
Owner Type
Purchase Details
Closed on
Sep 11, 2015
Sold by
Ingersoll Cheryl
Bought by
Passmore Gregory J and Passmore Stacy
Current Estimated Value
Home Financials for this Owner
Home Financials are based on the most recent Mortgage that was taken out on this home.
Original Mortgage
$257,600
Outstanding Balance
$203,153
Interest Rate
4.03%
Mortgage Type
New Conventional
Estimated Equity
$431,442
Create a Home Valuation Report for This Property
The Home Valuation Report is an in-depth analysis detailing your home's value as well as a comparison with similar homes in the area
Home Values in the Area
Average Home Value in this Area
Purchase History
| Date | Buyer | Sale Price | Title Company |
|---|---|---|---|
| Passmore Gregory J | -- | None Available |
Source: Public Records
Mortgage History
| Date | Status | Borrower | Loan Amount |
|---|---|---|---|
| Open | Passmore Gregory J | $257,600 |
Source: Public Records
Tax History Compared to Growth
Tax History
| Year | Tax Paid | Tax Assessment Tax Assessment Total Assessment is a certain percentage of the fair market value that is determined by local assessors to be the total taxable value of land and additions on the property. | Land | Improvement |
|---|---|---|---|---|
| 2025 | $8,376 | $584,655 | $170,000 | $414,655 |
| 2024 | $8,376 | $533,370 | $165,000 | $368,370 |
| 2023 | $8,376 | $543,063 | $0 | $0 |
| 2022 | $11,061 | $493,694 | $0 | $0 |
| 2021 | $10,620 | $452,800 | $80,000 | $372,800 |
| 2020 | $10,264 | $439,900 | $74,000 | $365,900 |
| 2019 | $9,714 | $370,920 | $0 | $0 |
| 2018 | $8,030 | $342,190 | $40,000 | $302,190 |
| 2017 | $6,712 | $326,820 | $40,000 | $286,820 |
| 2016 | $6,520 | $317,500 | $35,000 | $282,500 |
| 2015 | $5,080 | $306,750 | $35,000 | $271,750 |
| 2014 | $5,080 | $281,470 | $0 | $0 |
Source: Public Records
Map
Nearby Homes
- Lavender Plan at Goodland - Classic Series
- Chamberlaine Plan at Goodland - Manor Series
- Ormand Plan at Goodland - Garden Series
- Tulip Plan at Goodland - Classic Series
- Bluebonnet Plan at Goodland - Classic Series
- Beeville Plan at Goodland - Manor Series
- Chadbury Plan at Goodland - Garden Series
- Hastin Plan at Goodland - Garden Series
- Mccamey Plan at Goodland - Manor Series
- Mathew Plan at Goodland - Garden Series
- Rockwall Plan at Goodland - Manor Series
- Jasmine Plan at Goodland - Classic Series
- Peony Plan at Goodland - Classic Series
- Flintwood Plan at Goodland - Garden Series
- Primrose Plan at Goodland - Classic Series
- Avonlea Plan at Goodland - Manor Series
- Daisy Plan at Goodland - Classic Series
- Peterson Plan at Goodland - Garden Series
- Rose Plan at Goodland - Classic Series
- 3481 Oak Tree Ln
- 3231 Windridge Ct
- 3211 Windridge Ct
- 3220 Windridge Ct
- 821 Sherwood Ct
- 3210 Windridge Ct
- 3241 Windridge Ct
- 3230 Windridge Ct
- 3240 Windridge Ct
- 3251 Windridge Ct
- 811 Sherwood Ct
- 3250 Windridge Ct
- 1010 Lake Grove Loop
- 1014 Lake Grove Loop
- 1006 Lake Grove Loop
- 891 Hilltop Rd
- 1011 Hilltop Rd
- 1022 Lake Grove Loop
- 1018 Lake Grove Loop
- 1002 Lake Grove Loop
- 830 Sherwood Ct