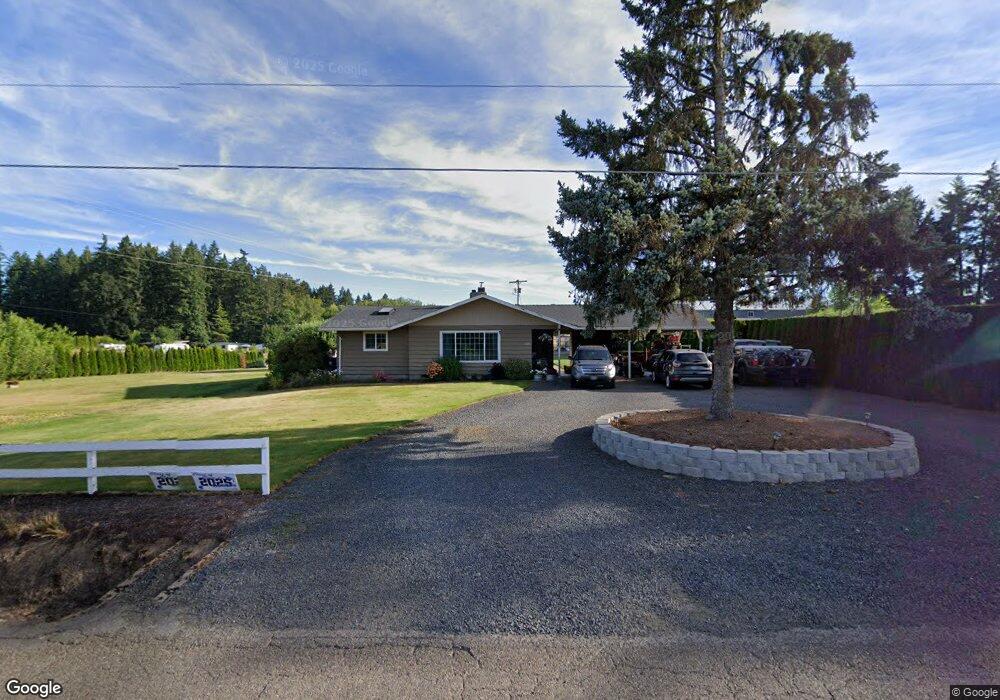
32215 SW Unger Rd Cornelius, OR 97113
Estimated Value: $716,545 - $805,000
3
Beds
2
Baths
1,528
Sq Ft
$498/Sq Ft
Est. Value
About This Home
This home is located at 32215 SW Unger Rd, Cornelius, OR 97113 and is currently estimated at $760,773, approximately $497 per square foot. 32215 SW Unger Rd is a home located in Washington County with nearby schools including Farmington View Elementary School, South Meadows Middle School, and Hillsboro High School.
Ownership History
Date
Name
Owned For
Owner Type
Purchase Details
Closed on
Mar 17, 2009
Sold by
Reyes Roy M and Reyes Gabriela
Bought by
Macdonald James D and Macdonald Jenessa D
Current Estimated Value
Home Financials for this Owner
Home Financials are based on the most recent Mortgage that was taken out on this home.
Original Mortgage
$348,570
Interest Rate
4.94%
Mortgage Type
FHA
Purchase Details
Closed on
Dec 12, 2005
Sold by
Reyes Roy M
Bought by
Reyes Roy M and Reyes Gabriela
Home Financials for this Owner
Home Financials are based on the most recent Mortgage that was taken out on this home.
Original Mortgage
$300,000
Interest Rate
6.07%
Mortgage Type
Fannie Mae Freddie Mac
Purchase Details
Closed on
Dec 5, 2005
Sold by
Stoltenburg Ronda and Stoltenburg Roy Rollo
Bought by
Reyes Roy M
Home Financials for this Owner
Home Financials are based on the most recent Mortgage that was taken out on this home.
Original Mortgage
$300,000
Interest Rate
6.07%
Mortgage Type
Fannie Mae Freddie Mac
Create a Home Valuation Report for This Property
The Home Valuation Report is an in-depth analysis detailing your home's value as well as a comparison with similar homes in the area
Home Values in the Area
Average Home Value in this Area
Purchase History
| Date | Buyer | Sale Price | Title Company |
|---|---|---|---|
| Macdonald James D | $355,000 | Stewart Title | |
| Reyes Roy M | -- | Transnation Title Agency Or | |
| Reyes Roy M | $375,000 | Transnation Title Agency Or |
Source: Public Records
Mortgage History
| Date | Status | Borrower | Loan Amount |
|---|---|---|---|
| Previous Owner | Macdonald James D | $348,570 | |
| Previous Owner | Reyes Roy M | $300,000 |
Source: Public Records
Tax History Compared to Growth
Tax History
| Year | Tax Paid | Tax Assessment Tax Assessment Total Assessment is a certain percentage of the fair market value that is determined by local assessors to be the total taxable value of land and additions on the property. | Land | Improvement |
|---|---|---|---|---|
| 2025 | $3,652 | $289,580 | -- | -- |
| 2024 | $3,381 | $292,440 | -- | -- |
| 2023 | $3,381 | $260,060 | $0 | $0 |
| 2022 | $3,295 | $260,060 | $0 | $0 |
| 2021 | $3,237 | $245,270 | $0 | $0 |
| 2020 | $3,170 | $238,130 | $0 | $0 |
| 2019 | $4,211 | $319,000 | $0 | $0 |
| 2018 | $2,954 | $224,470 | $0 | $0 |
| 2017 | $2,854 | $217,940 | $0 | $0 |
| 2016 | $2,698 | $211,600 | $0 | $0 |
| 2015 | $2,581 | $205,440 | $0 | $0 |
| 2014 | $2,572 | $199,460 | $0 | $0 |
Source: Public Records
Map
Nearby Homes
- 30190 SW Bald Peak Rd
- 34142 SW Johnson School Rd
- 34160 SW Peaks View Dr
- 13725 SW 329th Terrace
- 32333 SW Laurel Rd
- 5680 SW Minter Bridge Rd
- 36905 SW Goddard Rd
- 35963 SW Bald Peak Rd
- 37251 SW Thimbleberry Dr
- 6560 SW Rood Bridge Rd
- 6970 SW Straughan Rd
- 16532 SW Holly Hill Rd
- 5983 SW River Rd
- 16935 SW Holly Hill Rd
- 31155 SW Laurelview Rd
- 24730 SW Tile Flat Rd
- 34990 SW Cloudrest Ln
- 1540 SE Morgan Rd
- 38185 SW Laurelwood Rd
- 3445 SE San Marino Ave
- 32135 SW Unger Rd
- 32285 SW Unger Rd
- 32025 SW Unger Rd
- 32400 SW Unger Rd
- 9309 SW Line Dr
- 32323 SW Unger Rd
- 31980 SW Unger Rd
- 9273 SW Line Dr
- 32415 SW Unger Rd
- 9292 SW Line Dr
- 9255 SW Line Dr
- 9280 SW Line Dr
- 9268 SW Line Dr
- 9237 SW Line Dr
- 9345 SW Line Dr
- 9260 SW Line Dr
- 9248 SW Line Dr
- 31990 SW Unger Rd
- 9219 SW Line Dr
- 9373 SW Link St