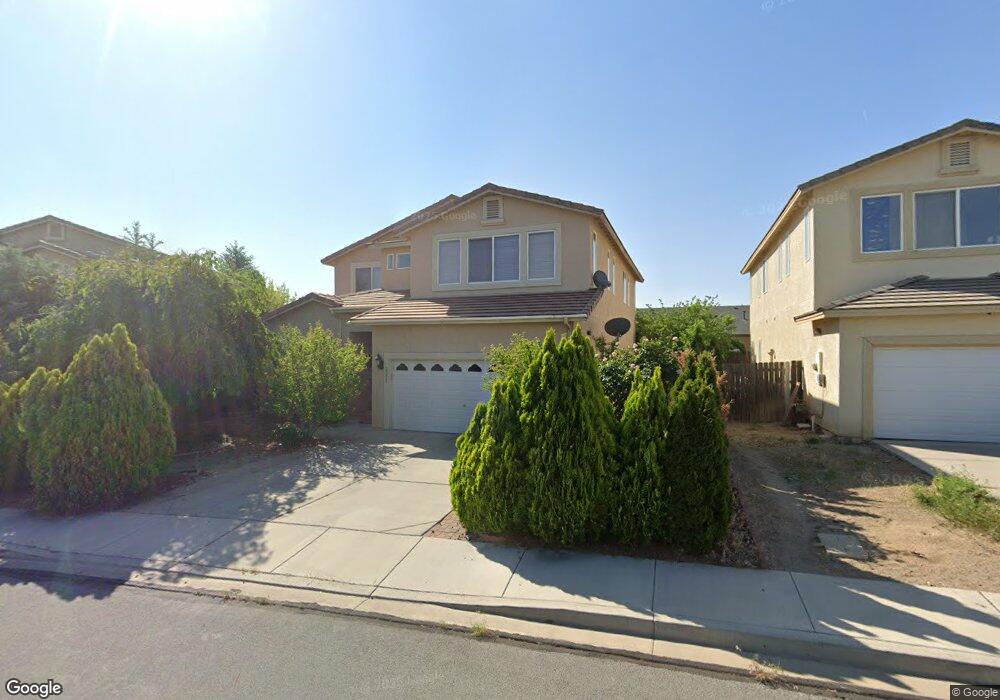
3222 Bentgrass Dr Sparks, NV 89431
Wildcreek NeighborhoodEstimated Value: $612,000 - $658,000
4
Beds
3
Baths
3,091
Sq Ft
$207/Sq Ft
Est. Value
About This Home
This home is located at 3222 Bentgrass Dr, Sparks, NV 89431 and is currently estimated at $640,889, approximately $207 per square foot. 3222 Bentgrass Dr is a home located in Washoe County with nearby schools including Bernice Mathews Elementary School, Fred W. Traner Middle School, and Procter R. Hug High School.
Ownership History
Date
Name
Owned For
Owner Type
Purchase Details
Closed on
Sep 3, 2009
Sold by
Silvas Peter Thomas and Silvas Jennifer C
Bought by
Roybal Alice N
Current Estimated Value
Purchase Details
Closed on
Aug 27, 2009
Sold by
Roybal Henry J
Bought by
Roybal Alice N
Purchase Details
Closed on
Jun 24, 2009
Sold by
Roybal Alice N
Bought by
Roybal Alice N and Roybal Henry J
Home Financials for this Owner
Home Financials are based on the most recent Mortgage that was taken out on this home.
Original Mortgage
$160,000
Interest Rate
4.83%
Mortgage Type
New Conventional
Purchase Details
Closed on
Dec 29, 2005
Sold by
Roybal Henry
Bought by
Roybal Alice N
Purchase Details
Closed on
Jul 7, 2005
Sold by
Consolidated Pacific Development Inc
Bought by
Roybal Alice N
Home Financials for this Owner
Home Financials are based on the most recent Mortgage that was taken out on this home.
Original Mortgage
$267,200
Interest Rate
6.36%
Mortgage Type
Fannie Mae Freddie Mac
Create a Home Valuation Report for This Property
The Home Valuation Report is an in-depth analysis detailing your home's value as well as a comparison with similar homes in the area
Home Values in the Area
Average Home Value in this Area
Purchase History
| Date | Buyer | Sale Price | Title Company |
|---|---|---|---|
| Roybal Alice N | -- | Stewart Title Of Nevada | |
| Roybal Alice N | -- | Stewart Title Of Nevada | |
| Roybal Alice N | -- | Stewart Title Of Nevada Reno | |
| Roybal Alice N | -- | First American Title | |
| Roybal Alice N | $334,500 | First American Title |
Source: Public Records
Mortgage History
| Date | Status | Borrower | Loan Amount |
|---|---|---|---|
| Previous Owner | Roybal Alice N | $160,000 | |
| Previous Owner | Roybal Alice N | $267,200 |
Source: Public Records
Tax History Compared to Growth
Tax History
| Year | Tax Paid | Tax Assessment Tax Assessment Total Assessment is a certain percentage of the fair market value that is determined by local assessors to be the total taxable value of land and additions on the property. | Land | Improvement |
|---|---|---|---|---|
| 2025 | $2,971 | $166,003 | $43,820 | $122,183 |
| 2024 | $2,886 | $157,123 | $34,475 | $122,648 |
| 2023 | $0 | $156,874 | $40,915 | $115,959 |
| 2022 | $2,803 | $133,979 | $37,485 | $96,494 |
| 2021 | $2,722 | $122,500 | $26,635 | $95,865 |
| 2020 | $2,641 | $122,362 | $26,390 | $95,972 |
| 2019 | $2,565 | $119,693 | $26,880 | $92,813 |
| 2018 | $2,490 | $109,905 | $19,355 | $90,550 |
| 2017 | $2,417 | $107,997 | $17,430 | $90,567 |
| 2016 | $2,356 | $104,228 | $15,610 | $88,618 |
| 2015 | $2,353 | $106,130 | $14,350 | $91,780 |
| 2014 | $2,284 | $79,003 | $11,515 | $67,488 |
| 2013 | -- | $61,153 | $9,450 | $51,703 |
Source: Public Records
Map
Nearby Homes
- 3485 Fairway Ct
- 3230 Creekside Ln Unit 1
- 3160 Creekside Ln Unit 1
- 3046 Sterling Ridge Cir
- 3116 Sterling Ridge Cir
- 3163 Sterling Ridge Cir
- 3516 Brassie Dr
- 3926 Clear Acre Ln Unit 107
- 3580 Mashie Ct Unit 1
- 3205 Kingsview Ct
- 3492 Mashie Dr
- 3921 Clear Acre Ln Unit 169
- 3919 Clear Acre Ln Unit 166
- 3919 Clear Acre Ln Unit 167
- 3725 El Rancho Dr
- 3949 Clear Acre Ln Unit 284
- 3952 Clear Acre Ln Unit 275
- 3951 Clear Acre Ln Unit 293
- 3951 Clear Acre Ln Unit 296
- 3880 E Leonesio Dr Unit C2
- 3214 Bentgrass Dr
- 3232 Bentgrass Dr
- 3195 Cityview Terrace
- 3181 Cityview Terrace
- 3242 Bentgrass Dr
- 3211 Cityview Terrace
- 3208 Bentgrass Dr
- 3211 City View Terrace
- 3161 Cityview Terrace
- 3161 Cityview Terrace Unit 431
- 3225 Bentgrass Dr
- 3221 Cityview Terrace Unit 2
- 3131 Cityview Terrace
- 3202 Bentgrass Dr
- 3252 Bentgrass Dr
- 3222 Fairway Dr
- 3202 Bentgrass Dr
- 3202 Bentgrass Dr Unit 1
- 3235 Cityview Terrace Unit 2
- 3238 Fairway Dr