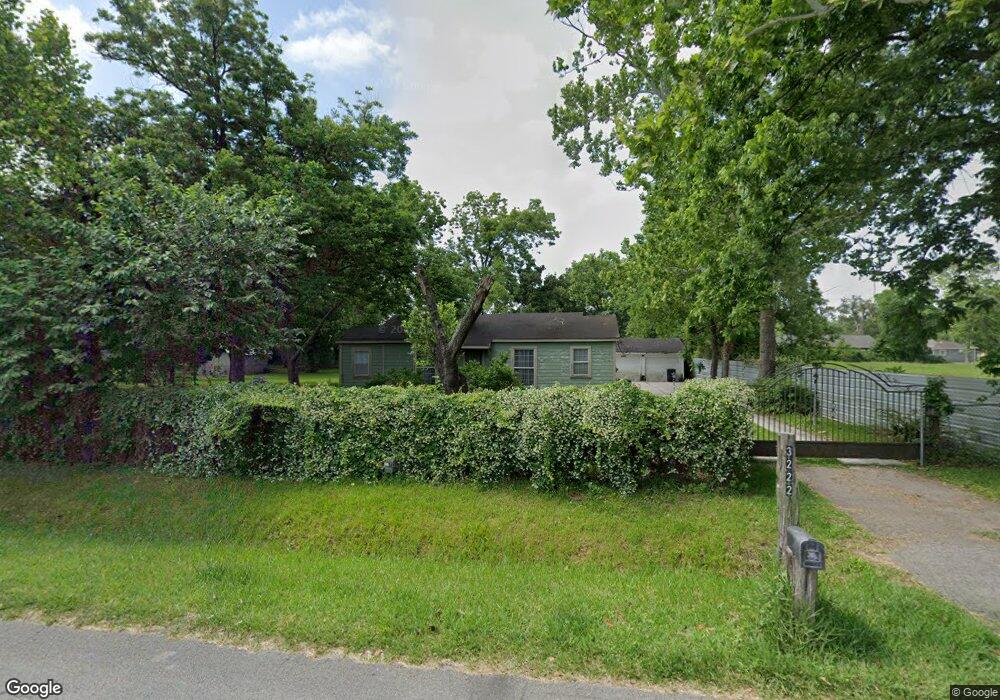
3222 Bostic St Houston, TX 77093
Eastex-Jensen NeighborhoodEstimated Value: $144,000 - $228,744
2
Beds
1
Bath
888
Sq Ft
$229/Sq Ft
Est. Value
About This Home
This home is located at 3222 Bostic St, Houston, TX 77093 and is currently estimated at $203,186, approximately $228 per square foot. 3222 Bostic St is a home located in Harris County with nearby schools including Berry Elementary School, Patrick Henry Middle School, and Kashmere High School.
Ownership History
Date
Name
Owned For
Owner Type
Purchase Details
Closed on
Aug 23, 2004
Sold by
Johnson Birdie
Bought by
Richardson Gregory and Richardson Stefhanie
Current Estimated Value
Purchase Details
Closed on
Jul 21, 2004
Sold by
Shepherd Ruth
Bought by
Richardson Gregory
Purchase Details
Closed on
May 19, 2004
Sold by
Brutner Reese Arnold and Brutner Ruth Bernice
Bought by
Martinez Jose Falcon
Home Financials for this Owner
Home Financials are based on the most recent Mortgage that was taken out on this home.
Original Mortgage
$79,900
Interest Rate
5.93%
Mortgage Type
Purchase Money Mortgage
Purchase Details
Closed on
Nov 14, 1996
Sold by
Ballard Rev Ivory
Bought by
New Mt Calvary Baptist Church
Home Financials for this Owner
Home Financials are based on the most recent Mortgage that was taken out on this home.
Original Mortgage
$22,714
Interest Rate
8.05%
Purchase Details
Closed on
Jun 9, 1996
Sold by
Williams Cleo R
Bought by
State Bond & Mtg Company
Create a Home Valuation Report for This Property
The Home Valuation Report is an in-depth analysis detailing your home's value as well as a comparison with similar homes in the area
Home Values in the Area
Average Home Value in this Area
Purchase History
| Date | Buyer | Sale Price | Title Company |
|---|---|---|---|
| Richardson Gregory | -- | -- | |
| Richardson Gregory | -- | -- | |
| Martinez Jose Falcon | -- | Fidelity National Title | |
| New Mt Calvary Baptist Church | -- | -- | |
| State Bond & Mtg Company | -- | -- |
Source: Public Records
Mortgage History
| Date | Status | Borrower | Loan Amount |
|---|---|---|---|
| Previous Owner | Martinez Jose Falcon | $79,900 | |
| Previous Owner | New Mt Calvary Baptist Church | $22,714 |
Source: Public Records
Tax History Compared to Growth
Tax History
| Year | Tax Paid | Tax Assessment Tax Assessment Total Assessment is a certain percentage of the fair market value that is determined by local assessors to be the total taxable value of land and additions on the property. | Land | Improvement |
|---|---|---|---|---|
| 2025 | $1,816 | $244,342 | $174,971 | $69,371 |
| 2024 | $1,816 | $242,957 | $174,971 | $67,986 |
| 2023 | $1,816 | $224,239 | $148,668 | $75,571 |
| 2022 | $2,913 | $162,162 | $97,206 | $64,956 |
| 2021 | $2,803 | $143,101 | $97,206 | $45,895 |
| 2020 | $2,648 | $136,040 | $97,206 | $38,834 |
| 2019 | $2,515 | $99,399 | $68,616 | $30,783 |
| 2018 | $1,683 | $97,560 | $68,616 | $28,944 |
| 2017 | $2,410 | $97,560 | $68,616 | $28,944 |
| 2016 | $2,191 | $97,560 | $68,616 | $28,944 |
| 2015 | $1,589 | $78,758 | $45,744 | $33,014 |
| 2014 | $1,589 | $88,412 | $45,744 | $42,668 |
Source: Public Records
Map
Nearby Homes
- 3008 Bostic St
- 2940 Sadler St
- 8814 Manus St Unit 1-11
- 2900 Luell St
- 3202 Laura Koppe Rd
- 2823 Berry Rd
- 3607 Penn St
- 8917 Etta St Unit A
- 2630 Keeland St
- 3529 Toliver St
- 2608 Bostic St
- 2624 Deams St
- 2821 E Crosstimbers St
- 9009 Ramin Dr
- 4106 Laura Koppe Rd
- 7718 Duncan St
- 4327 June St
- 4114 E Toliver E Street St
- 4129 E Toliver St
- 4133 E Toliver St
- 3310 Bostic St
- 3314 Bostic St
- 3206 Bostic St
- 3206 Bostic St Unit A
- 3206 Bostic St Unit B
- 3206 Bostic St Unit C
- 3206 Bostic St
- 3208 Bostic St Unit ID1254540P
- 3208 Bostic St
- 3208 Bostic St Unit A
- 3208 Bostic St Unit B
- 3208 Bostic St Unit C
- 3229 Bostic St
- 3367 Sadler St
- 8406 Curry Rd
- 3320 Bostic St
- 8328 Curry Rd
- 8326 Curry Rd Unit ID1227052P
- 8326 Curry Rd
- 8326 Curry Rd Unit B