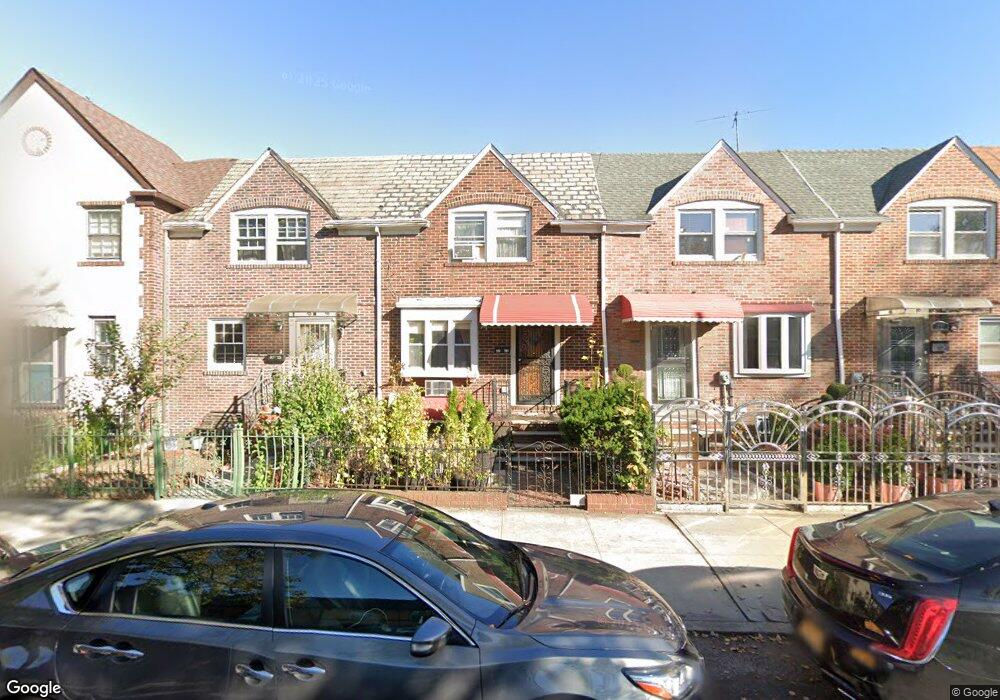
3223 53rd Place Woodside, NY 11377
Woodside NeighborhoodEstimated Value: $919,000 - $945,000
--
Bed
--
Bath
1,080
Sq Ft
$859/Sq Ft
Est. Value
About This Home
This home is located at 3223 53rd Place, Woodside, NY 11377 and is currently estimated at $928,230, approximately $859 per square foot. 3223 53rd Place is a home located in Queens County with nearby schools including P.S. 151 - Mary D. Carter, I.S. 010 Horace Greeley, and William Cullen Bryant High School.
Ownership History
Date
Name
Owned For
Owner Type
Purchase Details
Closed on
Jun 5, 2007
Sold by
Ochoa Juan and Ochoa Regina
Bought by
Sherpa Mingmar
Current Estimated Value
Home Financials for this Owner
Home Financials are based on the most recent Mortgage that was taken out on this home.
Original Mortgage
$120,200
Outstanding Balance
$72,994
Interest Rate
6.14%
Estimated Equity
$855,236
Purchase Details
Closed on
May 28, 2003
Sold by
Fazah Adib and The Elvira P Metzger Revocable Trust
Bought by
Ochoa Juan and Ochoa Regina
Home Financials for this Owner
Home Financials are based on the most recent Mortgage that was taken out on this home.
Original Mortgage
$283,500
Interest Rate
6.29%
Mortgage Type
Purchase Money Mortgage
Purchase Details
Closed on
Oct 12, 2000
Sold by
Metzger Elvira P
Bought by
Metzger Elvira P and The Elvira P Metzger Revocable Trust
Create a Home Valuation Report for This Property
The Home Valuation Report is an in-depth analysis detailing your home's value as well as a comparison with similar homes in the area
Home Values in the Area
Average Home Value in this Area
Purchase History
| Date | Buyer | Sale Price | Title Company |
|---|---|---|---|
| Sherpa Mingmar | $597,000 | -- | |
| Sherpa Mingmar | $597,000 | -- | |
| Ochoa Juan | $315,000 | -- | |
| Ochoa Juan | $315,000 | -- | |
| Metzger Elvira P | -- | Fidelity National Title Ins | |
| Metzger Elvira P | -- | Fidelity National Title Ins |
Source: Public Records
Mortgage History
| Date | Status | Borrower | Loan Amount |
|---|---|---|---|
| Open | Sherpa Mingmar | $120,200 | |
| Closed | Sherpa Mingmar | $120,200 | |
| Open | Sherpa Mingmar | $417,000 | |
| Closed | Sherpa Mingmar | $417,000 | |
| Previous Owner | Ochoa Juan | $283,500 |
Source: Public Records
Tax History Compared to Growth
Tax History
| Year | Tax Paid | Tax Assessment Tax Assessment Total Assessment is a certain percentage of the fair market value that is determined by local assessors to be the total taxable value of land and additions on the property. | Land | Improvement |
|---|---|---|---|---|
| 2025 | $6,997 | $36,427 | $9,506 | $26,921 |
| 2024 | $6,997 | $34,836 | $9,101 | $25,735 |
| 2023 | $6,997 | $34,836 | $8,097 | $26,739 |
| 2022 | $6,704 | $51,180 | $14,280 | $36,900 |
| 2021 | $6,668 | $52,020 | $14,280 | $37,740 |
| 2020 | $6,425 | $47,760 | $14,280 | $33,480 |
| 2019 | $6,073 | $51,120 | $14,280 | $36,840 |
| 2018 | $5,918 | $29,030 | $11,108 | $17,922 |
| 2017 | $5,705 | $27,986 | $9,897 | $18,089 |
| 2016 | $5,278 | $27,986 | $9,897 | $18,089 |
| 2015 | $3,184 | $25,297 | $13,068 | $12,229 |
| 2014 | $3,184 | $24,192 | $13,554 | $10,638 |
Source: Public Records
Map
Nearby Homes
- 31-98 54th St
- 31-31 54th St Unit 6
- 31-28 56th St
- 30-81 54th St Unit 4B
- 56-02 31st Ave Unit 2A
- 30-69 Hobart St Unit 2
- 56-05 31st Ave Unit 2O
- 56-05 31st Ave Unit I5C
- 55-23 31st Ave Unit 4H
- 55-03 31st Ave Unit C6K
- 5607 31st Ave Unit 1B
- 30-47 Hobart St Unit DDB
- 30- 47 Hobart St Unit 6
- 30-47 Hobart St Unit 5K
- 3045 Hobart St Unit 4H
- 53-31 37th Rd
- 30-68 50th St
- 3040 Hobart St
- 30-31 Hobart St Unit 6N
- 47-05 Newtown Rd