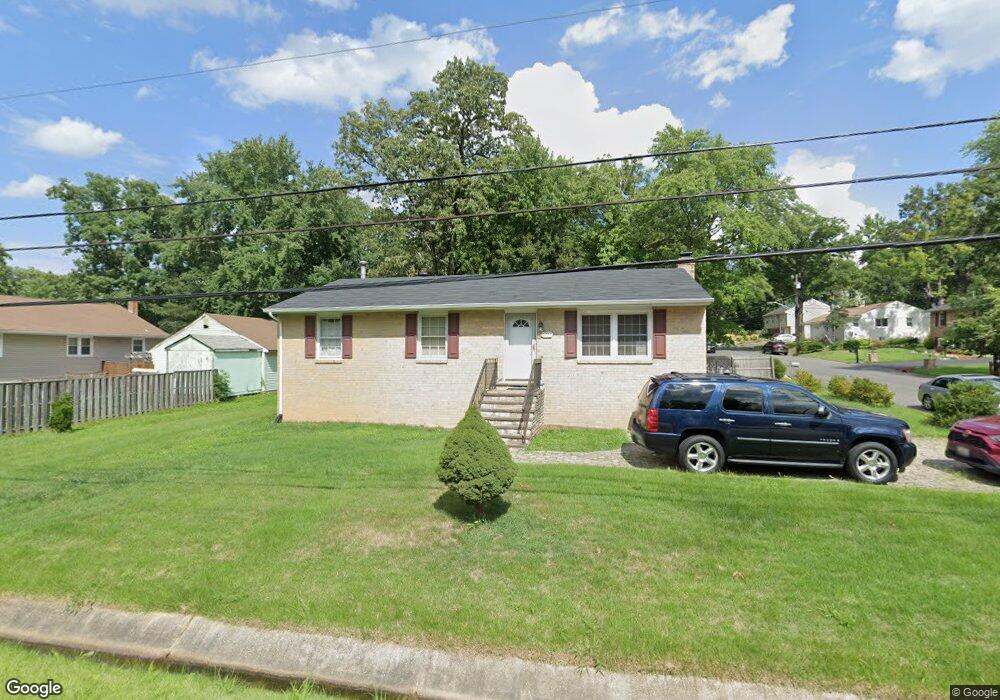
3223 Edge Ave Glenn Dale, MD 20769
Estimated Value: $424,354 - $470,000
--
Bed
2
Baths
1,204
Sq Ft
$373/Sq Ft
Est. Value
About This Home
This home is located at 3223 Edge Ave, Glenn Dale, MD 20769 and is currently estimated at $449,589, approximately $373 per square foot. 3223 Edge Ave is a home located in Prince George's County with nearby schools including Glenn Dale Elementary School, Thomas Johnson Middle School, and Duval High School.
Ownership History
Date
Name
Owned For
Owner Type
Purchase Details
Closed on
Nov 2, 2005
Sold by
Mclennon Mclennon R
Bought by
Marimi Purity
Current Estimated Value
Home Financials for this Owner
Home Financials are based on the most recent Mortgage that was taken out on this home.
Original Mortgage
$55,650
Outstanding Balance
$29,191
Interest Rate
5.54%
Mortgage Type
Credit Line Revolving
Estimated Equity
$420,398
Purchase Details
Closed on
Jul 29, 2005
Sold by
Mclennon Mclennon R
Bought by
Marimi Purity
Home Financials for this Owner
Home Financials are based on the most recent Mortgage that was taken out on this home.
Original Mortgage
$296,800
Interest Rate
5.54%
Mortgage Type
New Conventional
Purchase Details
Closed on
May 12, 2003
Sold by
Brown Andre C
Bought by
Mclennon R Sandra
Purchase Details
Closed on
Apr 30, 1992
Sold by
Hicks Scott J
Bought by
Brown Andre C
Create a Home Valuation Report for This Property
The Home Valuation Report is an in-depth analysis detailing your home's value as well as a comparison with similar homes in the area
Home Values in the Area
Average Home Value in this Area
Purchase History
| Date | Buyer | Sale Price | Title Company |
|---|---|---|---|
| Marimi Purity | $371,000 | -- | |
| Marimi Purity | $371,000 | -- | |
| Mclennon R Sandra | $200,000 | -- | |
| Brown Andre C | $146,500 | -- |
Source: Public Records
Mortgage History
| Date | Status | Borrower | Loan Amount |
|---|---|---|---|
| Open | Marimi Purity | $55,650 | |
| Open | Marimi Purity | $296,800 | |
| Closed | Marimi Purity | $55,650 | |
| Previous Owner | Marimi Purity | $296,800 |
Source: Public Records
Tax History Compared to Growth
Tax History
| Year | Tax Paid | Tax Assessment Tax Assessment Total Assessment is a certain percentage of the fair market value that is determined by local assessors to be the total taxable value of land and additions on the property. | Land | Improvement |
|---|---|---|---|---|
| 2025 | $4,382 | $330,600 | $126,200 | $204,400 |
| 2024 | $4,382 | $309,967 | $0 | $0 |
| 2023 | $4,209 | $289,333 | $0 | $0 |
| 2022 | $2,988 | $268,700 | $101,200 | $167,500 |
| 2021 | $5,219 | $257,333 | $0 | $0 |
| 2020 | $7,506 | $245,967 | $0 | $0 |
| 2019 | $3,908 | $234,600 | $100,600 | $134,000 |
| 2018 | $3,737 | $234,067 | $0 | $0 |
| 2017 | $3,526 | $233,533 | $0 | $0 |
| 2016 | -- | $233,000 | $0 | $0 |
| 2015 | $3,092 | $219,267 | $0 | $0 |
| 2014 | $3,092 | $205,533 | $0 | $0 |
Source: Public Records
Map
Nearby Homes
- 10108 Marguerita Ave
- 6212 Glenn Dale Rd
- 10206 Poplar St
- 9910 Locust St
- 6005 Armaan Dr
- 9911 Ridge St
- 9912 Martin Ave
- 11310 Daisy Ln
- 11310 Strawberry Glenn Ln
- 9912 Ridge St
- 6203 Wood Pointe Dr
- 6107 Wood Pointe Dr
- 11330 Old Prospect Hill Rd
- 10806 Javins St
- 10210 Poplar St
- 11411 Prospect Ct
- 6601 Facchina Ln
- 10801 Electric Ave
- 0 Lanham Severn Rd
- 0 Franklin St
- 10034 Worrell Ave
- 10033 Dubarry St
- 10033 Worrell Ave
- 10037 Dubarry St
- 10030 Worrell Ave
- 10037 Worrell Ave
- 10031 Dubarry St
- 10038 Worrell Ave
- 10025 Worrell Ave
- 10043 Dubarry St
- 10034 Dubarry St
- 10032 Locust St
- 10041 Worrell Ave
- 10022 Worrell Ave
- 10034 Locust St
- 10021 Dubarry St
- 10038 Dubarry St
- 3212 Edge Ave
- 10021 Worrell Ave
- 10042 Worrell Ave