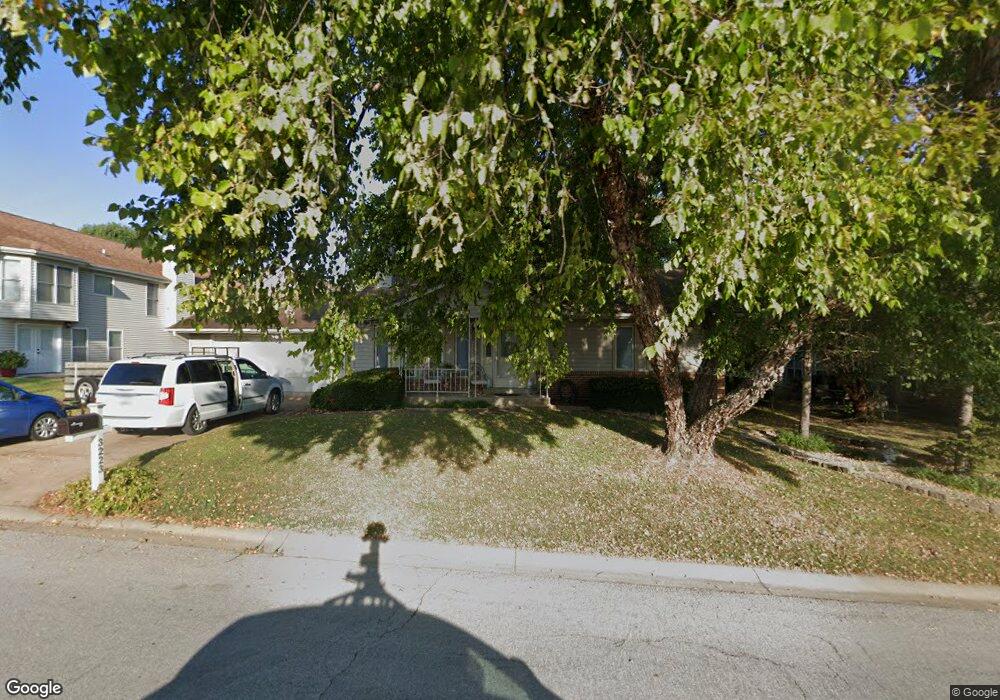
3223 Mamelles Dr Saint Charles, MO 63301
Old Town Saint Charles NeighborhoodEstimated Value: $282,000 - $327,000
3
Beds
2
Baths
1,200
Sq Ft
$257/Sq Ft
Est. Value
About This Home
This home is located at 3223 Mamelles Dr, Saint Charles, MO 63301 and is currently estimated at $307,882, approximately $256 per square foot. 3223 Mamelles Dr is a home located in St. Charles County with nearby schools including Discovery Elementary School, Orchard Farm Elementary School, and Orchard Farm Middle School.
Ownership History
Date
Name
Owned For
Owner Type
Purchase Details
Closed on
Mar 9, 2007
Sold by
Lang Matthew J and Lang Krystal D
Bought by
Thomson Michael and Thomson Pamela
Current Estimated Value
Home Financials for this Owner
Home Financials are based on the most recent Mortgage that was taken out on this home.
Original Mortgage
$169,700
Outstanding Balance
$102,661
Interest Rate
6.25%
Mortgage Type
Purchase Money Mortgage
Estimated Equity
$205,221
Purchase Details
Closed on
Dec 30, 2004
Sold by
Miller Michael B
Bought by
Lang Matthew J and Proctor Krystal D
Home Financials for this Owner
Home Financials are based on the most recent Mortgage that was taken out on this home.
Original Mortgage
$117,290
Interest Rate
5.8%
Mortgage Type
Credit Line Revolving
Purchase Details
Closed on
Sep 28, 2001
Sold by
Alderman Billie L and Alderman Marianne
Bought by
Miller Michael B
Home Financials for this Owner
Home Financials are based on the most recent Mortgage that was taken out on this home.
Original Mortgage
$28,600
Interest Rate
6.37%
Create a Home Valuation Report for This Property
The Home Valuation Report is an in-depth analysis detailing your home's value as well as a comparison with similar homes in the area
Home Values in the Area
Average Home Value in this Area
Purchase History
| Date | Buyer | Sale Price | Title Company |
|---|---|---|---|
| Thomson Michael | $169,700 | Ort | |
| Lang Matthew J | -- | -- | |
| Miller Michael B | -- | -- |
Source: Public Records
Mortgage History
| Date | Status | Borrower | Loan Amount |
|---|---|---|---|
| Open | Thomson Michael | $169,700 | |
| Previous Owner | Lang Matthew J | $117,290 | |
| Previous Owner | Miller Michael B | $28,600 | |
| Closed | Miller Michael B | $90,021 |
Source: Public Records
Tax History Compared to Growth
Tax History
| Year | Tax Paid | Tax Assessment Tax Assessment Total Assessment is a certain percentage of the fair market value that is determined by local assessors to be the total taxable value of land and additions on the property. | Land | Improvement |
|---|---|---|---|---|
| 2025 | $3,000 | $44,541 | -- | -- |
| 2023 | $2,999 | $43,041 | $0 | $0 |
| 2022 | $2,204 | $30,265 | $0 | $0 |
| 2021 | $2,201 | $30,265 | $0 | $0 |
| 2020 | $2,257 | $31,114 | $0 | $0 |
| 2019 | $2,052 | $31,114 | $0 | $0 |
| 2018 | $1,972 | $28,786 | $0 | $0 |
| 2017 | $1,961 | $28,786 | $0 | $0 |
| 2016 | $1,545 | $23,274 | $0 | $0 |
| 2015 | $1,557 | $23,274 | $0 | $0 |
| 2014 | $1,800 | $26,276 | $0 | $0 |
Source: Public Records
Map
Nearby Homes
- 3353 Steeple Hill
- 2 Copper Trail Ct
- 3291 River Breeze Ct
- 3457 Carriage Crossing
- 3396 Charlestowne Crossing Dr
- 3173 Cog Wheel Station
- 3349 Bentwater Place
- 3055 Devilla Trail Unit 8B
- 3348 Bentwater Place
- 3184 Country Bluff Dr
- 3305 Charlestowne Crossing Dr
- 3101 Flatboat Station
- 3100 Osterly Bend
- 3220 River Breeze Ct
- 3272 River Breeze Ct
- Ashton Plan at River Breeze - Hometown Collection
- Stamford Plan at River Breeze - Hometown Collection
- Madison Plan at River Breeze - Hometown Collection
- Sheridan Plan at River Breeze - Hometown Collection
- Audubon Plan at River Breeze - Hometown Collection
- 902 Apricot Dr
- 3341 Cottonwood Dr
- 904 Apricot Dr
- 3345 Cottonwood Dr
- 908 Apricot Dr
- 3224 Mamelles Dr
- 3336 Cottonwood Dr
- 3333 Cottonwood Dr
- 808 Apricot Dr
- 901 Apricot Dr
- 3349 Cottonwood Dr
- 3340 Cottonwood Dr
- 912 Apricot Dr
- 3332 Cottonwood Dr
- 905 Apricot Dr
- 813 Apricot Dr
- 3344 Cottonwood Dr
- 3329 Cottonwood Dr
- 909 Apricot Dr
- 804 Apricot Dr