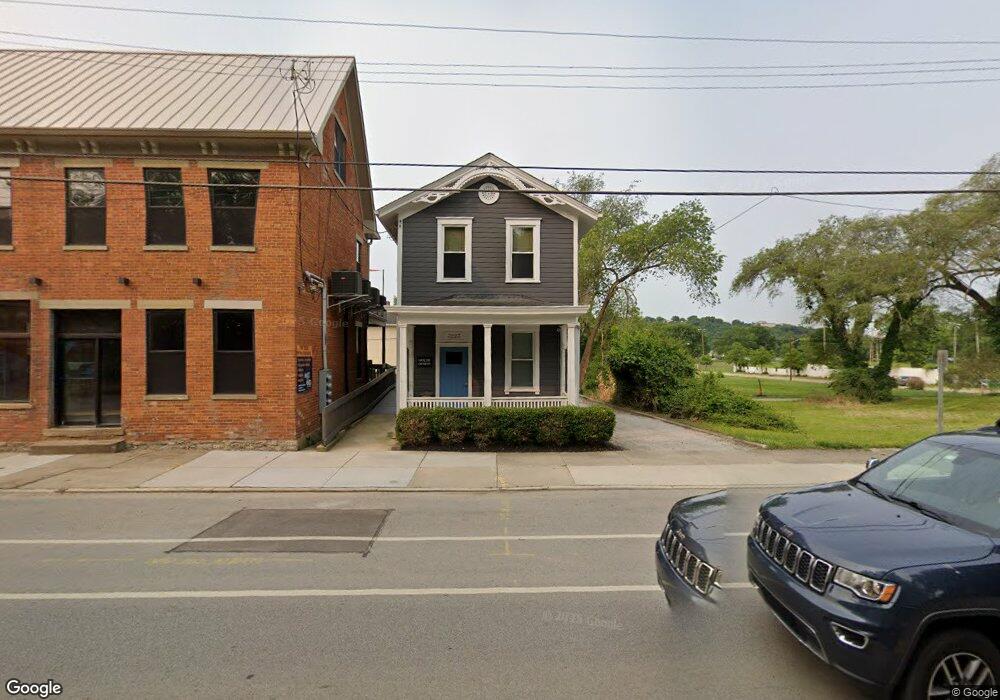
3223 Riverside Dr Cincinnati, OH 45226
East End NeighborhoodEstimated Value: $216,424 - $367,000
2
Beds
1
Bath
1,440
Sq Ft
$192/Sq Ft
Est. Value
About This Home
This home is located at 3223 Riverside Dr, Cincinnati, OH 45226 and is currently estimated at $276,606, approximately $192 per square foot. 3223 Riverside Dr is a home located in Hamilton County with nearby schools including Clark Montessori High School, Withrow University High School, and Shroder High School.
Ownership History
Date
Name
Owned For
Owner Type
Purchase Details
Closed on
Dec 18, 2025
Sold by
Motz Properties Llc
Bought by
3223 Riverside Llc
Current Estimated Value
Purchase Details
Closed on
Mar 8, 2016
Sold by
Bryan Carlier Llc
Bought by
Grote Leo Tr
Home Financials for this Owner
Home Financials are based on the most recent Mortgage that was taken out on this home.
Interest Rate
3.64%
Purchase Details
Closed on
Feb 25, 2016
Sold by
Grote Leo
Bought by
Motz Real Estate Llc
Home Financials for this Owner
Home Financials are based on the most recent Mortgage that was taken out on this home.
Interest Rate
3.64%
Purchase Details
Closed on
Feb 22, 2010
Sold by
Carlie Bryan
Bought by
Bryan Carlier Llc
Purchase Details
Closed on
Aug 6, 2008
Sold by
Slt Properties Llc
Bought by
Carlier Bryan
Purchase Details
Closed on
Oct 7, 2006
Sold by
Hatton & Schimpf Development Inc
Bought by
Slt Properties Llc
Purchase Details
Closed on
Jun 30, 2000
Sold by
Smith Warren and Doe Jane
Bought by
Hatton and Hatton Schimpf
Create a Home Valuation Report for This Property
The Home Valuation Report is an in-depth analysis detailing your home's value as well as a comparison with similar homes in the area
Home Values in the Area
Average Home Value in this Area
Purchase History
| Date | Buyer | Sale Price | Title Company |
|---|---|---|---|
| 3223 Riverside Llc | -- | None Listed On Document | |
| Grote Leo Tr | $90,000 | -- | |
| Motz Real Estate Llc | -- | None Available | |
| Bryan Carlier Llc | -- | Attorney | |
| Carlier Bryan | $23,100 | Attorney | |
| Slt Properties Llc | $65,500 | Attorney | |
| Hatton | $3,538 | -- |
Source: Public Records
Mortgage History
| Date | Status | Borrower | Loan Amount |
|---|---|---|---|
| Previous Owner | Grote Leo Tr | -- |
Source: Public Records
Tax History
| Year | Tax Paid | Tax Assessment Tax Assessment Total Assessment is a certain percentage of the fair market value that is determined by local assessors to be the total taxable value of land and additions on the property. | Land | Improvement |
|---|---|---|---|---|
| 2025 | $2,958 | $46,375 | $6,713 | $39,662 |
| 2023 | $2,959 | $46,375 | $6,713 | $39,662 |
| 2022 | $2,438 | $34,314 | $4,501 | $29,813 |
| 2021 | $2,391 | $34,314 | $4,501 | $29,813 |
| 2020 | $2,397 | $34,314 | $4,501 | $29,813 |
| 2019 | $2,305 | $30,100 | $3,948 | $26,152 |
| 2018 | $2,307 | $30,100 | $3,948 | $26,152 |
| 2017 | $2,222 | $30,100 | $3,948 | $26,152 |
| 2016 | $1,402 | $18,477 | $3,948 | $14,529 |
| 2015 | $1,254 | $18,477 | $3,948 | $14,529 |
| 2014 | $1,261 | $18,477 | $3,948 | $14,529 |
| 2013 | $1,282 | $18,477 | $3,948 | $14,529 |
Source: Public Records
Map
Nearby Homes
- 2939 Walworth Ave
- 3089 Walworth Ave
- 3322 Walworth Ave
- 260 Watson St
- 271 Strader Ave
- 269 Strader Ave
- 267 Strader Ave
- 265 Strader Ave
- 263 Strader Ave
- 261 Strader Ave
- 259 Strader Ave
- 3219 Riverside Dr
- 3021 Riverside Dr
- 3435 Golden Ave
- 226 Worth St
- 3446 Golden Ave
- 3450 Golden Ave
- 3441 Wool St
- 559 Delta Terrace
- 536 Hoge St
- 3223 Riverside Dr Unit 1
- 3215 Riverside Dr
- 3225 Riverside Dr
- 3227 Riverside Dr Unit 1
- 3227 Riverside Dr
- 3211 Riverside Dr
- 263 Wenner St
- 259 Wenner St
- 3229 Riverside Dr
- 3151 Riverside Dr
- 3243 Riverside Dr
- 3147 Riverside Dr
- 252 Wenner St
- 3145 Riverside Dr
- 250 Wenner St
- 3143 Riverside Dr
- 3251 Riverside Dr
- 3230 Walworth Ave
- 3226 Walworth Ave
- 3232 Walworth Ave
Your Personal Tour Guide
Ask me questions while you tour the home.