32231 River Park Dr Magnolia, TX 77355
Estimated Value: $497,000 - $923,000
3
Beds
3
Baths
2,844
Sq Ft
$271/Sq Ft
Est. Value
About This Home
This home is located at 32231 River Park Dr, Magnolia, TX 77355 and is currently estimated at $769,467, approximately $270 per square foot. 32231 River Park Dr is a home located in Montgomery County with nearby schools including Willie E. Williams Elementary School, Magnolia Sixth Grade Campus, and Magnolia Junior High School.
Ownership History
Date
Name
Owned For
Owner Type
Purchase Details
Closed on
Aug 8, 2014
Sold by
Meier David B and Meier Annie Laurie
Bought by
Halquist Kent David and Halquist Mary Cornwall
Current Estimated Value
Purchase Details
Closed on
Jun 19, 2009
Sold by
Peavy Will Jordan and Peavy Michelle
Bought by
Meier David B and Meier Laurie
Home Financials for this Owner
Home Financials are based on the most recent Mortgage that was taken out on this home.
Original Mortgage
$350,000
Interest Rate
4.84%
Mortgage Type
Purchase Money Mortgage
Purchase Details
Closed on
Jun 8, 2007
Sold by
Warriner Paul A and Warriner Nilushka
Bought by
Halquist Kent D and Halquist Mary C
Home Financials for this Owner
Home Financials are based on the most recent Mortgage that was taken out on this home.
Original Mortgage
$206,250
Interest Rate
6.16%
Mortgage Type
Purchase Money Mortgage
Create a Home Valuation Report for This Property
The Home Valuation Report is an in-depth analysis detailing your home's value as well as a comparison with similar homes in the area
Home Values in the Area
Average Home Value in this Area
Purchase History
| Date | Buyer | Sale Price | Title Company |
|---|---|---|---|
| Halquist Kent David | -- | Stewart Title | |
| Meier David B | -- | Stewart Title Of Montgomery | |
| Halquist Kent D | -- | -- | |
| Peavy Will Jordan | -- | None Available |
Source: Public Records
Mortgage History
| Date | Status | Borrower | Loan Amount |
|---|---|---|---|
| Previous Owner | Meier David B | $350,000 | |
| Previous Owner | Peavy Will Jordan | $206,250 | |
| Previous Owner | Halquist Kent D | $68,750 |
Source: Public Records
Tax History Compared to Growth
Tax History
| Year | Tax Paid | Tax Assessment Tax Assessment Total Assessment is a certain percentage of the fair market value that is determined by local assessors to be the total taxable value of land and additions on the property. | Land | Improvement |
|---|---|---|---|---|
| 2025 | $9,722 | $849,000 | $266,598 | $582,402 |
| 2024 | $9,722 | $817,201 | -- | -- |
| 2023 | $9,659 | $742,910 | $266,600 | $551,400 |
| 2022 | $11,918 | $675,370 | $266,600 | $497,960 |
| 2021 | $11,412 | $613,970 | $197,480 | $416,490 |
| 2020 | $11,764 | $581,310 | $197,480 | $383,830 |
| 2019 | $12,170 | $604,290 | $197,480 | $406,810 |
| 2018 | $12,535 | $641,580 | $98,740 | $557,500 |
| 2017 | $12,368 | $583,250 | $98,740 | $490,070 |
| 2016 | $11,244 | $530,230 | $98,740 | $431,490 |
| 2015 | $9,527 | $485,680 | $98,740 | $386,940 |
| 2014 | $9,527 | $454,150 | $98,740 | $355,410 |
Source: Public Records
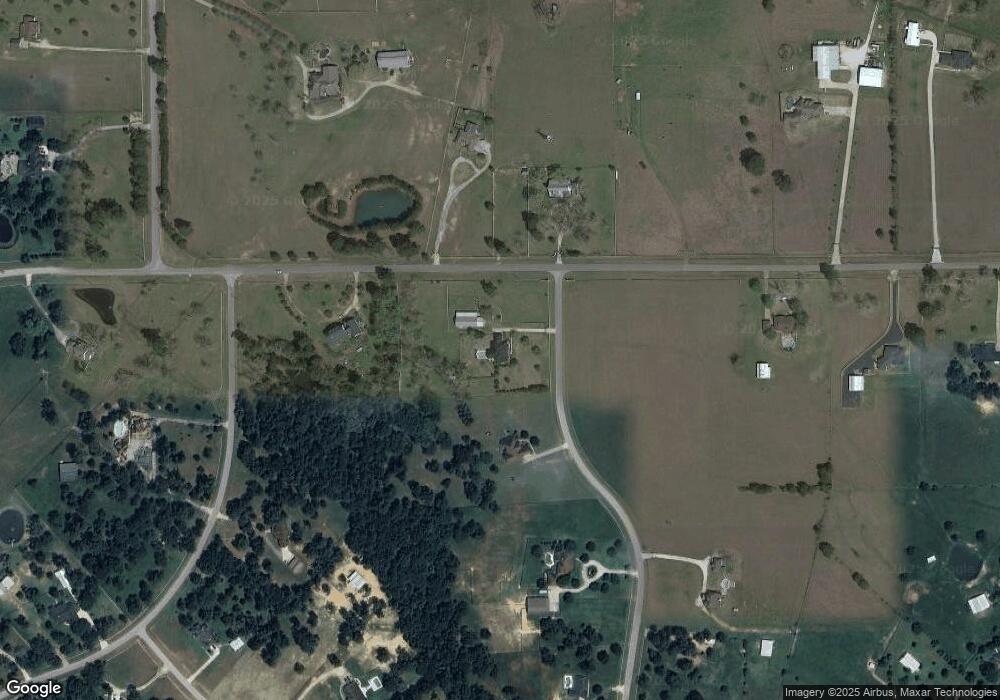
Map
Nearby Homes
- 34030 Old Hempstead Rd
- 32118 River Park Dr
- 32210 Park Meadow Pass
- 32210 Mink Creek Ct
- 32127 River Park Dr
- 34310 High Point Dr
- 537 Ruel Ln
- 18846 Maverick Ranch Rd W
- 32219 Grapevine St
- 1125 Wandering Brook St
- 34010 Bar r Blvd
- Borden Plan at Escondido - 50' Homesites
- Barnum Plan at Escondido - 50' Homesites
- Borden Plan at Escondido - 60' Homesites
- Allred Plan at Escondido - 50' Homesites
- Berlin Plan at Escondido - 50' Homesites
- 42660 Mystery Ln
- Ortega Plan at Escondido - 60' Homesites
- 1483 Florecer Ln
- Conway Plan at Escondido - 60' Homesites
- 21647 Alberta Forest Cir
- 21640 Alberta Forest Cir
- 21611 Alberta Forest Cir
- 21632 Alberta Forest Cir
- 21639 Alberta Forest Cir
- 21635 Alberta Forest Cir
- 21615 Alberta Forest Cir
- 32227 River Park Dr
- 34105 Old Hempstead Rd
- 32223 River Park Dr
- 34010 Old Hempstead Rd
- 34020 Old Hempstead Rd
- 34005 Old Hempstead Rd
- Lot 20 River Park Dr
- LOT 17 River Park Dr
- 00 River Park Dr
- 202 Ruel Rd
- 32215 River Park Dr
- 32218 River Park Dr
- 32218 River Park Dr