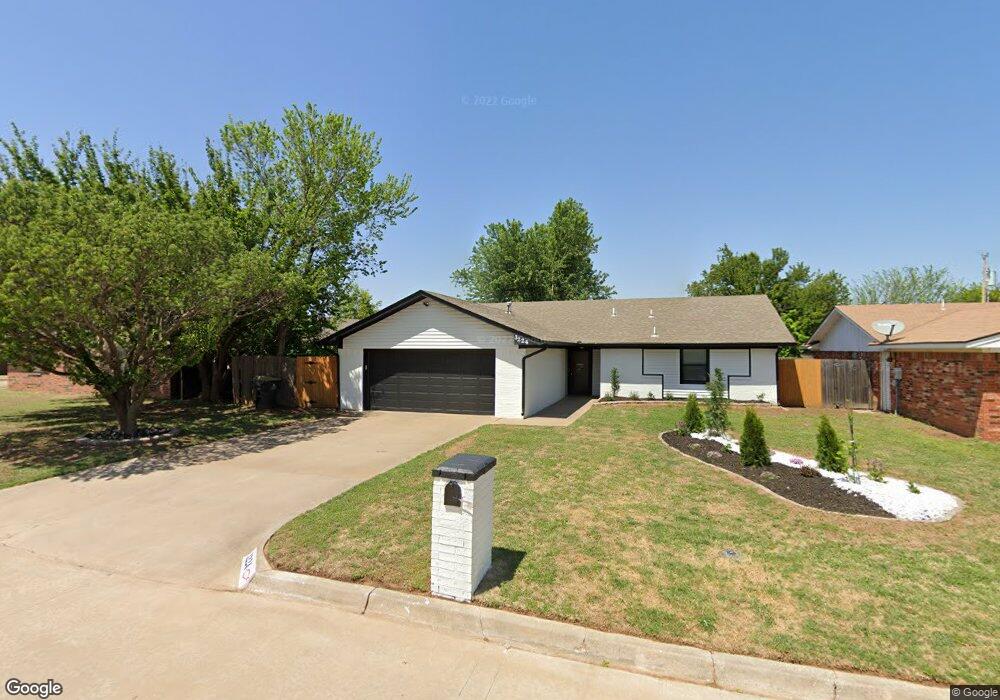
3224 Arizona Ave Chickasha, OK 73018
Estimated Value: $184,000 - $215,000
3
Beds
2
Baths
1,541
Sq Ft
$128/Sq Ft
Est. Value
About This Home
This home is located at 3224 Arizona Ave, Chickasha, OK 73018 and is currently estimated at $197,409, approximately $128 per square foot. 3224 Arizona Ave is a home located in Grady County with nearby schools including Grand Avenue Elementary School, Chickasha Middle School, and Lincoln Elementary School.
Ownership History
Date
Name
Owned For
Owner Type
Purchase Details
Closed on
May 27, 2021
Sold by
Bollman Joy F
Bought by
Blair Shevon A and Blair Shelbi M
Current Estimated Value
Home Financials for this Owner
Home Financials are based on the most recent Mortgage that was taken out on this home.
Original Mortgage
$123,624
Outstanding Balance
$111,859
Interest Rate
3%
Mortgage Type
New Conventional
Estimated Equity
$85,550
Purchase Details
Closed on
May 24, 2010
Sold by
Norvell Connie and Norvell Steve
Bought by
Bollman Joy F
Purchase Details
Closed on
Sep 26, 2008
Sold by
Page Brandon and Page Brandon Scott
Bought by
Mooney Connie
Purchase Details
Closed on
Jun 20, 2006
Sold by
Denney Doris
Bought by
Page Brandon and Page Rachelle
Home Financials for this Owner
Home Financials are based on the most recent Mortgage that was taken out on this home.
Original Mortgage
$50,000
Interest Rate
6.56%
Mortgage Type
Purchase Money Mortgage
Create a Home Valuation Report for This Property
The Home Valuation Report is an in-depth analysis detailing your home's value as well as a comparison with similar homes in the area
Home Values in the Area
Average Home Value in this Area
Purchase History
| Date | Buyer | Sale Price | Title Company |
|---|---|---|---|
| Blair Shevon A | $137,500 | Washita Valley Abstract & Tt | |
| Bollman Joy F | $120,000 | None Available | |
| Mooney Connie | $108,000 | None Available | |
| Page Brandon | $89,500 | None Available |
Source: Public Records
Mortgage History
| Date | Status | Borrower | Loan Amount |
|---|---|---|---|
| Open | Blair Shevon A | $123,624 | |
| Previous Owner | Page Brandon | $50,000 |
Source: Public Records
Tax History Compared to Growth
Tax History
| Year | Tax Paid | Tax Assessment Tax Assessment Total Assessment is a certain percentage of the fair market value that is determined by local assessors to be the total taxable value of land and additions on the property. | Land | Improvement |
|---|---|---|---|---|
| 2025 | $1,691 | $17,509 | $1,490 | $16,019 |
| 2024 | $1,691 | $16,675 | $1,419 | $15,256 |
| 2023 | $1,691 | $15,881 | $1,482 | $14,399 |
| 2022 | $1,573 | $15,125 | $1,048 | $14,077 |
| 2021 | $1,228 | $12,219 | $1,048 | $11,171 |
| 2020 | $1,086 | $12,542 | $1,048 | $11,494 |
| 2019 | $1,065 | $12,542 | $1,048 | $11,494 |
| 2018 | $1,128 | $12,962 | $1,048 | $11,914 |
| 2017 | $1,160 | $13,201 | $1,018 | $12,183 |
| 2016 | $1,169 | $13,201 | $1,018 | $12,183 |
| 2015 | $1,173 | $13,201 | $1,018 | $12,183 |
| 2014 | $1,173 | $13,201 | $1,018 | $12,183 |
Source: Public Records
Map
Nearby Homes
- 3208 California Ave
- 3400 W Mississippi Ave
- 2210 Lakewood Dr
- 2412 S 30th St
- 2305 Lakewood Dr
- 2812 Scissortail Dr
- 2821 S 27th Ct
- 2329 S 28th Terrace
- 2825 S 27th Ct
- 2328 S 27th Ct
- 2817 S 27th Ct
- 2805 S 27th Ct
- 2329 S 27th Ct
- 2409 S 27th Ct
- 2401 S 28th Terrace
- 2400 S 27th Ct
- 2801 S 27th Ct
- 2325 S 28th Terrace
- 2405 S 28th Terrace
- 2325 S 27th Ct
- 3220 Arizona Ave
- 2317 S 33rd St
- 3216 Arizona Ave
- 3241 California Ave
- 3245 California Ave
- 3237 California Ave
- 3225 Arizona Ave
- 3212 Arizona Ave
- 3217 Arizona Ave
- 3221 Arizona Ave
- 2407 S 33rd St
- 3233 California Ave
- 3304 Arizona Ave
- 3229 California Ave
- 3208 Arizona Ave
- 3213 Arizona Ave
- 3308 Arizona Ave
- 3305 Arizona Ave
- 3225 California Ave
- 3209 Arizona Ave