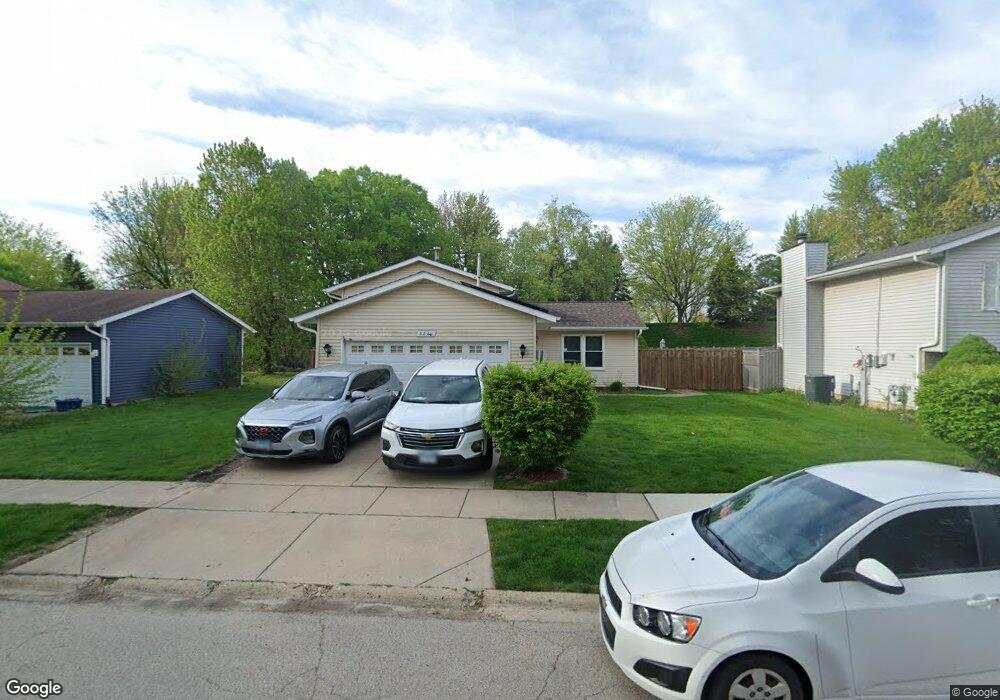
3224 Cathy Dr Unit 3 Joliet, IL 60431
Southwest Joliet NeighborhoodEstimated Value: $306,969 - $331,000
3
Beds
2
Baths
1,830
Sq Ft
$176/Sq Ft
Est. Value
About This Home
This home is located at 3224 Cathy Dr Unit 3, Joliet, IL 60431 and is currently estimated at $322,242, approximately $176 per square foot. 3224 Cathy Dr Unit 3 is a home located in Will County with nearby schools including Heritage Trail Elementary School, Troy Middle School, and Orenic Intermediate School.
Ownership History
Date
Name
Owned For
Owner Type
Purchase Details
Closed on
May 30, 2003
Sold by
Lemley David A
Bought by
Rahimi Mark F and Meister Anna M
Current Estimated Value
Home Financials for this Owner
Home Financials are based on the most recent Mortgage that was taken out on this home.
Original Mortgage
$159,743
Outstanding Balance
$70,482
Interest Rate
5.88%
Mortgage Type
FHA
Estimated Equity
$251,760
Purchase Details
Closed on
Mar 17, 2003
Sold by
Washington Mutual Bank Fa
Bought by
Lemley David A
Home Financials for this Owner
Home Financials are based on the most recent Mortgage that was taken out on this home.
Original Mortgage
$100,800
Interest Rate
4.25%
Mortgage Type
Purchase Money Mortgage
Purchase Details
Closed on
May 21, 2002
Sold by
Maffeo Thomas E and Maffeo Dianna M
Bought by
Washington Mutual Bank Fa
Create a Home Valuation Report for This Property
The Home Valuation Report is an in-depth analysis detailing your home's value as well as a comparison with similar homes in the area
Home Values in the Area
Average Home Value in this Area
Purchase History
| Date | Buyer | Sale Price | Title Company |
|---|---|---|---|
| Rahimi Mark F | $162,000 | -- | |
| Lemley David A | $126,000 | Multiple | |
| Washington Mutual Bank Fa | -- | First American Title |
Source: Public Records
Mortgage History
| Date | Status | Borrower | Loan Amount |
|---|---|---|---|
| Open | Rahimi Mark F | $159,743 | |
| Previous Owner | Lemley David A | $100,800 |
Source: Public Records
Tax History Compared to Growth
Tax History
| Year | Tax Paid | Tax Assessment Tax Assessment Total Assessment is a certain percentage of the fair market value that is determined by local assessors to be the total taxable value of land and additions on the property. | Land | Improvement |
|---|---|---|---|---|
| 2024 | $7,283 | $90,954 | $13,296 | $77,658 |
| 2023 | $7,283 | $81,720 | $11,946 | $69,774 |
| 2022 | $6,858 | $73,153 | $11,304 | $61,849 |
| 2021 | $5,837 | $68,817 | $10,634 | $58,183 |
| 2020 | $5,113 | $60,949 | $10,634 | $50,315 |
| 2019 | $4,952 | $58,464 | $10,200 | $48,264 |
| 2018 | $4,922 | $56,600 | $10,200 | $46,400 |
| 2017 | $4,512 | $51,500 | $10,200 | $41,300 |
| 2016 | $4,309 | $47,900 | $10,200 | $37,700 |
| 2015 | $4,131 | $44,673 | $9,073 | $35,600 |
| 2014 | $4,131 | $43,823 | $9,073 | $34,750 |
| 2013 | $4,131 | $47,026 | $9,073 | $37,953 |
Source: Public Records
Map
Nearby Homes
- 3223 Karen Ct
- 3266 Cathy Dr
- 3104 Meadowsedge Ln
- 985 Leawood Dr
- 3219 Quincy Ct
- 2903 Clearview Ct
- 2812 Clearview Dr
- 644 Spring Leaf Dr
- 710 Silver Leaf Ct Unit 1
- 597 Spring Leaf Dr
- 594 Spring Leaf Dr
- 615 Silver Leaf Dr
- 743 Springwood Dr
- 2780 Channahon Rd
- 197 Barbara Jean Ln Unit 4
- 2632 Crescenzo Dr
- 2626 Crescenzo Dr Unit F
- 2542 Par Four Ct Unit 12B
- 180 Barbara Jean Ln Unit D
- 181 Saenz Ln Unit A22
- 3230 Cathy Dr Unit 3
- 3218 Cathy Dr
- 3212 Cathy Dr
- 3236 Cathy Dr Unit 3
- 3219 Cathy Dr Unit 3
- 3225 Cathy Dr
- 3206 Cathy Dr
- 3213 Cathy Dr
- 3207 Cathy Dr Unit 3
- 3242 Cathy Dr Unit 3
- 3237 Cathy Dr
- 3201 Cathy Dr
- 3200 Cathy Dr
- 3243 Cathy Dr
- 3248 Cathy Dr
- 1137 Cathy Dr
- 3249 Cathy Dr
- 3254 Cathy Dr
- 1154 Cathy Dr Unit 3
- 1131 Cathy Dr Unit 3