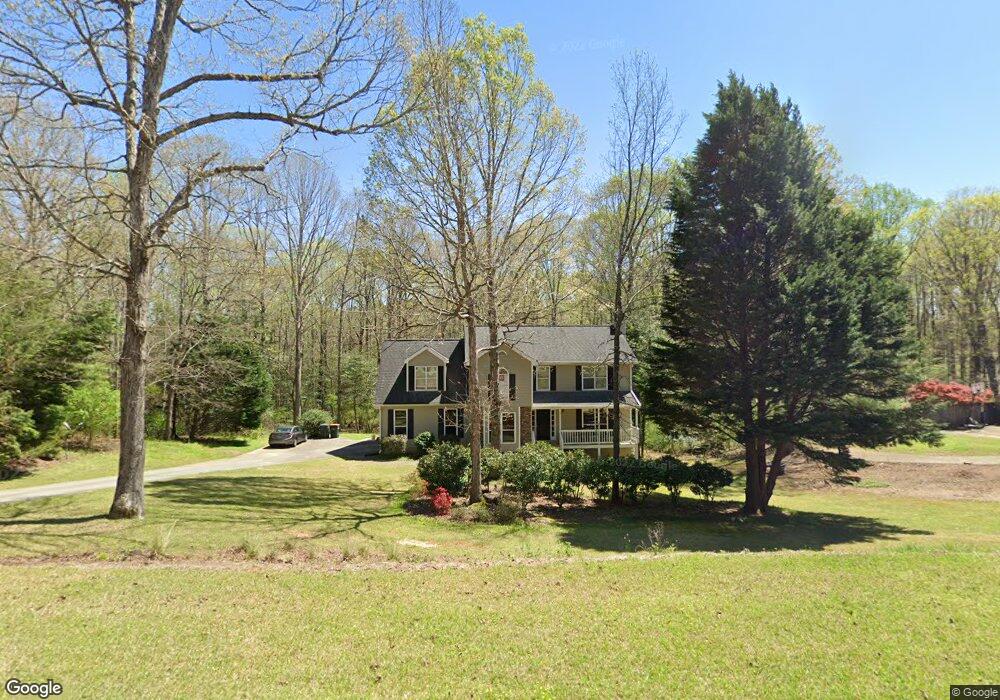
3224 Holly Stand Ct Loganville, GA 30052
Estimated Value: $379,465 - $394,000
--
Bed
--
Bath
2,069
Sq Ft
$187/Sq Ft
Est. Value
About This Home
This home is located at 3224 Holly Stand Ct, Loganville, GA 30052 and is currently estimated at $387,616, approximately $187 per square foot. 3224 Holly Stand Ct is a home located in Walton County with nearby schools including Bay Creek Elementary School, Loganville Middle School, and Loganville High School.
Ownership History
Date
Name
Owned For
Owner Type
Purchase Details
Closed on
Apr 25, 2024
Sold by
Arroyo Aviles Francisco
Bought by
Arroyo Aviles Francisco and Arroyo Aviles Francisco
Current Estimated Value
Home Financials for this Owner
Home Financials are based on the most recent Mortgage that was taken out on this home.
Original Mortgage
$392,540
Outstanding Balance
$386,574
Interest Rate
6.79%
Mortgage Type
New Conventional
Estimated Equity
$1,042
Purchase Details
Closed on
Apr 26, 1996
Sold by
Therrel Alec R Cyndi A
Bought by
Mileshko James Rachelle
Purchase Details
Closed on
Jul 16, 1993
Sold by
Mccart Plumbing Inc
Bought by
Therrel Alec R and Therrel Cyndi A
Home Financials for this Owner
Home Financials are based on the most recent Mortgage that was taken out on this home.
Original Mortgage
$91,500
Interest Rate
7.49%
Create a Home Valuation Report for This Property
The Home Valuation Report is an in-depth analysis detailing your home's value as well as a comparison with similar homes in the area
Home Values in the Area
Average Home Value in this Area
Purchase History
| Date | Buyer | Sale Price | Title Company |
|---|---|---|---|
| Arroyo Aviles Francisco | -- | -- | |
| Arroyo Aviles Francisco | $380,000 | -- | |
| Mileshko James Rachelle | $127,000 | -- | |
| Therrel Alec R | $114,400 | -- |
Source: Public Records
Mortgage History
| Date | Status | Borrower | Loan Amount |
|---|---|---|---|
| Open | Arroyo Aviles Francisco | $392,540 | |
| Previous Owner | Therrel Alec R | $91,500 | |
| Closed | Mileshko James Rachelle | $0 |
Source: Public Records
Tax History Compared to Growth
Tax History
| Year | Tax Paid | Tax Assessment Tax Assessment Total Assessment is a certain percentage of the fair market value that is determined by local assessors to be the total taxable value of land and additions on the property. | Land | Improvement |
|---|---|---|---|---|
| 2024 | $743 | $135,124 | $21,200 | $113,924 |
| 2023 | $3,065 | $131,764 | $21,200 | $110,564 |
| 2022 | $2,948 | $115,604 | $18,400 | $97,204 |
| 2021 | $2,641 | $95,644 | $17,600 | $78,044 |
| 2020 | $2,484 | $85,084 | $14,800 | $70,284 |
| 2019 | $2,270 | $71,084 | $11,600 | $59,484 |
| 2018 | $2,185 | $71,084 | $11,600 | $59,484 |
| 2017 | $2,398 | $69,604 | $11,600 | $58,004 |
| 2016 | $2,148 | $67,544 | $11,600 | $55,944 |
| 2015 | $2,043 | $61,704 | $10,000 | $51,704 |
| 2014 | $1,558 | $46,524 | $0 | $0 |
Source: Public Records
Map
Nearby Homes
- 4885 Watson Mill Ct
- 3971 Dean Grove Way
- 5363 Forest Dr
- 5474 Forest Dr Unit 4
- 903 Creek Bottom Rd
- 932 Creek Bottom Rd Unit 1
- 619 Landing Way
- 209 Birchwood Dr
- 207 Birchwood Dr
- 3661 Bay Cove Ct
- 5317 Highway 81
- 5357 Highway 81
- 3847 Cove Top Ct
- 905 Shannon Rd SW
- 200 Birchwood Dr
- 5457 Highway 81
- 3571 Coveside Ct
- 3234 Holly Stand Ct
- 3214 Holly Stand Ct
- 3225 Holly Stand Ct
- 3235 Holly Stand Ct
- 3244 Holly Stand Ct
- 3215 Holly Stand Ct
- 3204 Holly Stand Ct
- 3205 Holly Stand Ct
- 3245 Holly Stand Ct
- 4754 Watson Mill Ct
- 4764 Watson Mill Ct
- 3254 Holly Stand Ct
- 3255 Holly Stand Ct
- 4744 Watson Mill Ct
- 3264 Holly Stand Ct
- 4894 Watson Mill Ct
- 4904 Watson Mill Ct
- 4884 Watson Mill Ct
- 3265 Holly Stand Ct
- 3195 Holly Stand Ct