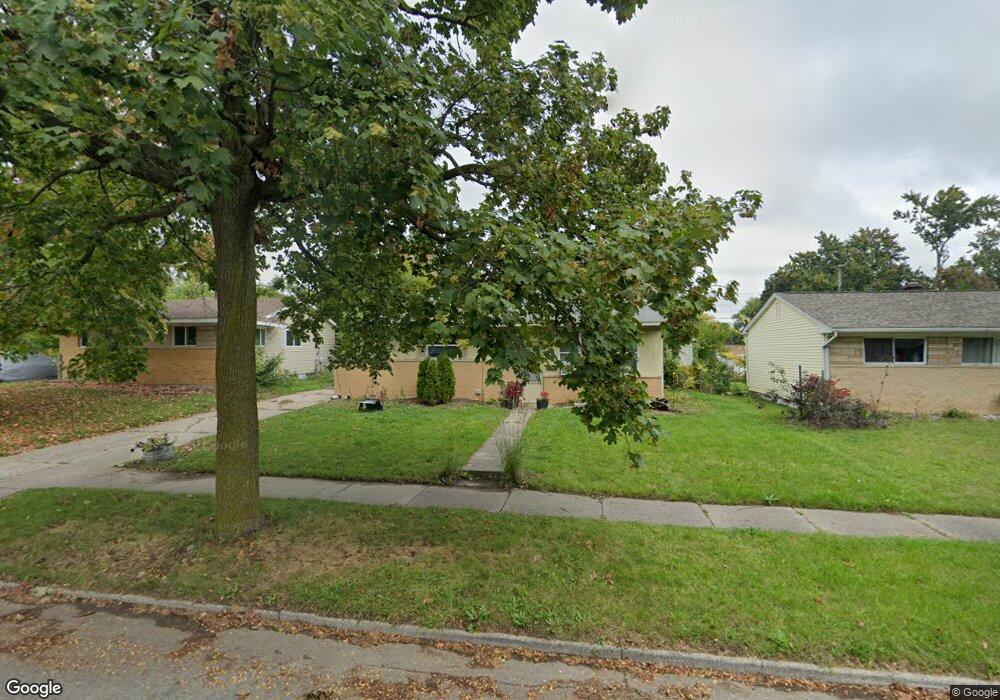
3224 Reo Rd Lansing, MI 48911
Churchill Downs NeighborhoodEstimated Value: $103,662 - $132,000
--
Bed
--
Bath
963
Sq Ft
$121/Sq Ft
Est. Value
About This Home
This home is located at 3224 Reo Rd, Lansing, MI 48911 and is currently estimated at $116,416, approximately $120 per square foot. 3224 Reo Rd is a home located in Ingham County with nearby schools including Reo Elementary School, Attwood School, and J.W. Sexton High School.
Ownership History
Date
Name
Owned For
Owner Type
Purchase Details
Closed on
Jan 6, 2022
Sold by
Lambert George H and Lambert Teresa A
Bought by
Crankshaw Michael and Crankshaw Heather
Current Estimated Value
Home Financials for this Owner
Home Financials are based on the most recent Mortgage that was taken out on this home.
Original Mortgage
$52,700
Outstanding Balance
$41,775
Interest Rate
2.79%
Mortgage Type
New Conventional
Estimated Equity
$74,641
Purchase Details
Closed on
Jul 15, 2019
Sold by
Huber Dale D and Huber Sara E
Bought by
Lambert George H and Lambert Teresa A
Purchase Details
Closed on
Nov 5, 2012
Sold by
Dismuke Darin Wayne
Bought by
Complete Housing Solution Llc
Purchase Details
Closed on
May 24, 2012
Sold by
Dismuke Ruthie Mae
Bought by
Wells Fargo Financial America Inc
Create a Home Valuation Report for This Property
The Home Valuation Report is an in-depth analysis detailing your home's value as well as a comparison with similar homes in the area
Home Values in the Area
Average Home Value in this Area
Purchase History
| Date | Buyer | Sale Price | Title Company |
|---|---|---|---|
| Crankshaw Michael | $62,050 | None Listed On Document | |
| Lambert George H | -- | Cinnaire Title Services | |
| Complete Housing Solution Llc | -- | None Available | |
| Wells Fargo Financial America Inc | $9,828 | None Available |
Source: Public Records
Mortgage History
| Date | Status | Borrower | Loan Amount |
|---|---|---|---|
| Open | Crankshaw Michael | $52,700 |
Source: Public Records
Tax History Compared to Growth
Tax History
| Year | Tax Paid | Tax Assessment Tax Assessment Total Assessment is a certain percentage of the fair market value that is determined by local assessors to be the total taxable value of land and additions on the property. | Land | Improvement |
|---|---|---|---|---|
| 2025 | $2,116 | $54,300 | $9,200 | $45,100 |
| 2024 | $16 | $50,700 | $9,200 | $41,500 |
| 2023 | $1,986 | $45,000 | $9,200 | $35,800 |
| 2022 | $1,793 | $39,900 | $9,200 | $30,700 |
| 2021 | $1,756 | $36,200 | $5,800 | $30,400 |
| 2020 | $1,745 | $33,100 | $5,800 | $27,300 |
| 2019 | $1,671 | $31,800 | $5,800 | $26,000 |
| 2018 | $1,571 | $28,000 | $5,800 | $22,200 |
| 2017 | $1,504 | $28,000 | $5,800 | $22,200 |
| 2016 | $1,487 | $26,200 | $5,800 | $20,400 |
| 2015 | $1,487 | $25,300 | $11,612 | $13,688 |
| 2014 | $1,487 | $25,800 | $18,334 | $7,466 |
Source: Public Records
Map
Nearby Homes
- 3115 Risdale Ave
- 4809 Ballard Rd
- 3600 Ronald St
- 4828 Ingham St
- 5100 Wexford Rd
- 4000 Churchill Ave
- 2816 Greenbelt Dr
- 3006 Hillcrest St
- 4018 Clayborn Rd
- 2416 Midwood St
- 2311 Greenbelt Dr
- 4110 Richmond St
- 4328 Chadburne Dr
- 4628 Pleasant Grove Rd
- 3100 Glenbrook Dr
- 4017 Richmond St
- 4009 Heathgate Dr
- 3424 S Catherine St
- 5424 S Waverly Rd
- 4107 Windward Dr