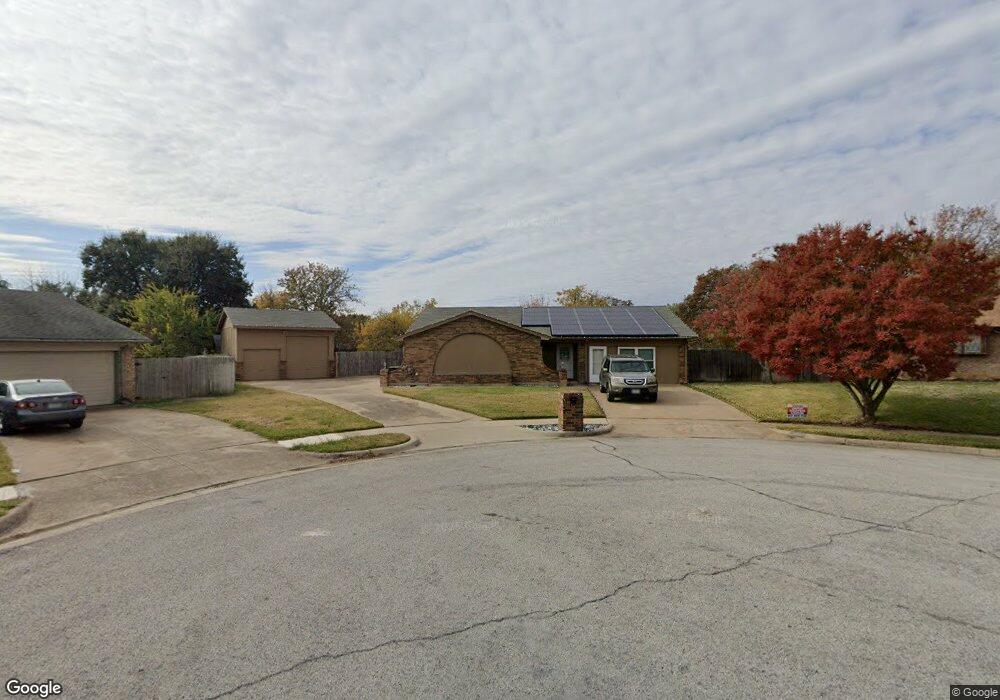
3224 Whisperwood Ct Bedford, TX 76021
Estimated Value: $380,000 - $448,000
3
Beds
2
Baths
2,376
Sq Ft
$174/Sq Ft
Est. Value
About This Home
This home is located at 3224 Whisperwood Ct, Bedford, TX 76021 and is currently estimated at $413,245, approximately $173 per square foot. 3224 Whisperwood Ct is a home located in Tarrant County with nearby schools including Spring Garden Elementary School, Harwood Junior High School, and Trinity High School.
Ownership History
Date
Name
Owned For
Owner Type
Purchase Details
Closed on
Sep 29, 2016
Sold by
Hite Randy G and Hite Josei K
Bought by
Mayfield Mcahcael A
Current Estimated Value
Home Financials for this Owner
Home Financials are based on the most recent Mortgage that was taken out on this home.
Original Mortgage
$260,482
Outstanding Balance
$208,063
Interest Rate
3.43%
Estimated Equity
$205,182
Purchase Details
Closed on
Apr 11, 2011
Sold by
Hite Randy G and Hite Jodie K
Bought by
Hite Randy G and Hite Jodie K
Home Financials for this Owner
Home Financials are based on the most recent Mortgage that was taken out on this home.
Original Mortgage
$104,000
Interest Rate
4.92%
Mortgage Type
Credit Line Revolving
Purchase Details
Closed on
Nov 24, 1998
Sold by
Lacy A Gene A and Lacy Carolyn L
Bought by
Hite Randy G and Hite Jodi K
Home Financials for this Owner
Home Financials are based on the most recent Mortgage that was taken out on this home.
Original Mortgage
$99,200
Interest Rate
6.69%
Create a Home Valuation Report for This Property
The Home Valuation Report is an in-depth analysis detailing your home's value as well as a comparison with similar homes in the area
Home Values in the Area
Average Home Value in this Area
Purchase History
| Date | Buyer | Sale Price | Title Company |
|---|---|---|---|
| Mayfield Mcahcael A | -- | Allegiance Title | |
| Hite Randy G | -- | First American | |
| Hite Randy G | -- | Rattikin Title Co |
Source: Public Records
Mortgage History
| Date | Status | Borrower | Loan Amount |
|---|---|---|---|
| Open | Mayfield Mcahcael A | $260,482 | |
| Previous Owner | Hite Randy G | $104,000 | |
| Previous Owner | Hite Randy G | $99,200 |
Source: Public Records
Tax History Compared to Growth
Tax History
| Year | Tax Paid | Tax Assessment Tax Assessment Total Assessment is a certain percentage of the fair market value that is determined by local assessors to be the total taxable value of land and additions on the property. | Land | Improvement |
|---|---|---|---|---|
| 2025 | $2,122 | $312,167 | $70,000 | $242,167 |
| 2024 | $2,122 | $375,698 | $70,000 | $305,698 |
| 2023 | $7,087 | $369,511 | $45,000 | $324,511 |
| 2022 | $8,527 | $390,446 | $45,000 | $345,446 |
| 2021 | $8,361 | $379,004 | $45,000 | $334,004 |
| 2020 | $7,671 | $323,399 | $45,000 | $278,399 |
| 2019 | $7,126 | $326,446 | $45,000 | $281,446 |
| 2018 | $3,943 | $266,657 | $45,000 | $221,657 |
| 2017 | $5,864 | $242,415 | $30,000 | $212,415 |
| 2016 | $4,953 | $204,745 | $30,000 | $174,745 |
| 2015 | $4,519 | $191,112 | $30,000 | $161,112 |
| 2014 | $4,519 | $190,900 | $18,000 | $172,900 |
Source: Public Records
Map
Nearby Homes
- 3152 Woodbridge Dr
- 2600 Willow Bend
- 3024 Highgate Ln
- 2709 Willow Bend
- 2922 Beachtree Ln
- 2616 Greenwood Ct
- 3017 Bluebonnet Ln
- 2909 Oakridge Dr
- 2220 Tiffany Glenn Ct
- 3721 Fieldcrest Ln
- 2521 Sanders Ct
- 3405 Scenic Hills Dr
- 3001 Glenwood Ct
- 2209 Laurel Ct
- 2305 Meadowlark Ln
- 2609 Talisman Ct
- 3024 Pecan Cir
- 3816 Rolling Meadows Dr
- 3840 Edgewater Dr
- 3532 Meadowside Dr
- 3221 Whisperwood Ct
- 3100 Woodbridge Dr
- 3032 Woodbridge Dr
- 3220 Whisperwood Ct
- 3217 Mossy Oak Ct
- 3104 Woodbridge Dr
- 3213 Mossy Oak Ct
- 3028 Woodbridge Dr
- 3217 Whisperwood Ct
- 3216 Whisperwood Ct
- 3108 Woodbridge Dr
- 3024 Woodbridge Dr
- 3221 Mossy Oak Ct
- 3212 Whisperwood Ct
- 3112 Woodbridge Dr
- 3213 Whisperwood Ct
- 3225 Mossy Oak Ln
- 3417 Meadow Wood Ct
- 3020 Woodbridge Dr
- 3101 Woodbridge Dr