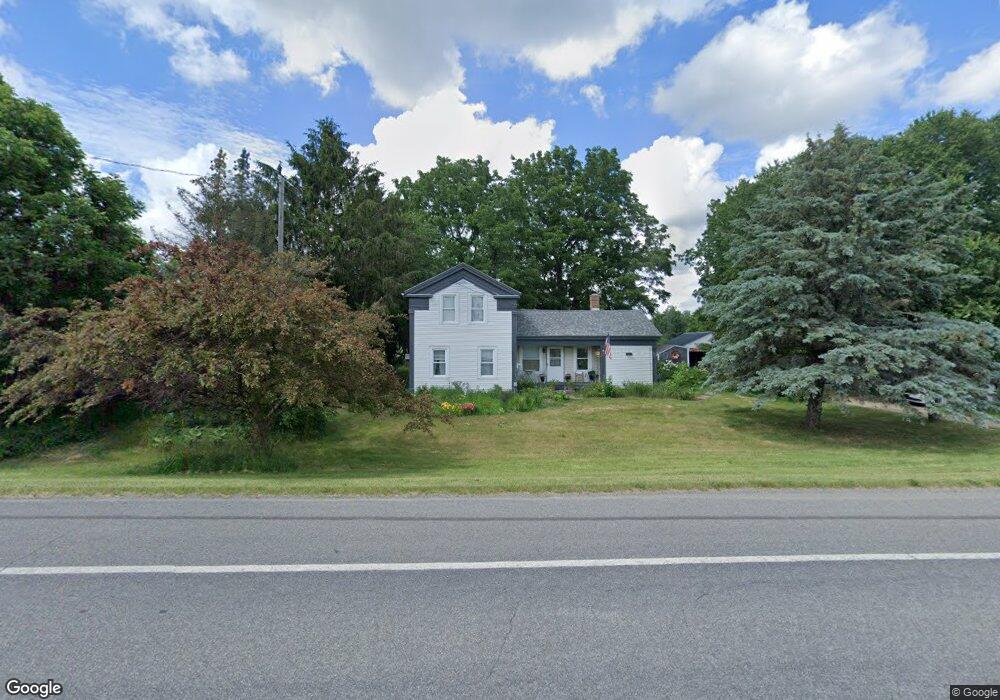
32246 Michigan 43 Paw Paw, MI 49079
Estimated Value: $270,000 - $356,000
2
Beds
2
Baths
1,400
Sq Ft
$215/Sq Ft
Est. Value
About This Home
This home is located at 32246 Michigan 43, Paw Paw, MI 49079 and is currently estimated at $300,531, approximately $214 per square foot. 32246 Michigan 43 is a home located in Van Buren County with nearby schools including Gobles Elementary School, Gobles High School, and Michigan Online School.
Ownership History
Date
Name
Owned For
Owner Type
Purchase Details
Closed on
Oct 5, 2021
Sold by
Staley Justin R
Bought by
Leon Maria D
Current Estimated Value
Home Financials for this Owner
Home Financials are based on the most recent Mortgage that was taken out on this home.
Original Mortgage
$235,653
Outstanding Balance
$214,894
Interest Rate
2.8%
Mortgage Type
FHA
Estimated Equity
$85,637
Purchase Details
Closed on
Dec 14, 2007
Sold by
Conor Christopher J
Bought by
Staley Justin R
Home Financials for this Owner
Home Financials are based on the most recent Mortgage that was taken out on this home.
Original Mortgage
$118,366
Interest Rate
6.13%
Mortgage Type
Unknown
Purchase Details
Closed on
May 5, 2000
Sold by
Jamieson Nolan A and Jamieson Varerie J
Bought by
Conor Christopher J
Purchase Details
Closed on
Aug 26, 1998
Sold by
Jamieson Nolan A and Jamieson Cynthia
Bought by
Jamieson Nolan
Create a Home Valuation Report for This Property
The Home Valuation Report is an in-depth analysis detailing your home's value as well as a comparison with similar homes in the area
Home Values in the Area
Average Home Value in this Area
Purchase History
| Date | Buyer | Sale Price | Title Company |
|---|---|---|---|
| Leon Maria D | $240,375 | None Available | |
| Staley Justin R | $116,000 | Metro Advantage Title Agency | |
| Conor Christopher J | $112,900 | -- | |
| Jamieson Nolan | -- | -- |
Source: Public Records
Mortgage History
| Date | Status | Borrower | Loan Amount |
|---|---|---|---|
| Open | Leon Maria D | $235,653 | |
| Previous Owner | Staley Justin R | $118,366 |
Source: Public Records
Tax History Compared to Growth
Tax History
| Year | Tax Paid | Tax Assessment Tax Assessment Total Assessment is a certain percentage of the fair market value that is determined by local assessors to be the total taxable value of land and additions on the property. | Land | Improvement |
|---|---|---|---|---|
| 2025 | $934 | $126,800 | $0 | $0 |
| 2024 | $934 | $113,900 | $0 | $0 |
| 2023 | $890 | $103,600 | $0 | $0 |
| 2022 | $2,941 | $79,600 | $0 | $0 |
| 2021 | $2,160 | $67,900 | $27,500 | $40,400 |
| 2020 | $2,045 | $67,900 | $27,500 | $40,400 |
| 2019 | $1,952 | $66,100 | $66,100 | $0 |
| 2018 | $1,907 | $61,600 | $61,600 | $0 |
| 2017 | $1,867 | $57,500 | $0 | $0 |
| 2016 | $1,854 | $54,600 | $0 | $0 |
| 2015 | $1,639 | $54,600 | $0 | $0 |
| 2014 | $1,695 | $52,600 | $0 | $0 |
| 2013 | -- | $57,900 | $57,900 | $0 |
Source: Public Records
Map
Nearby Homes