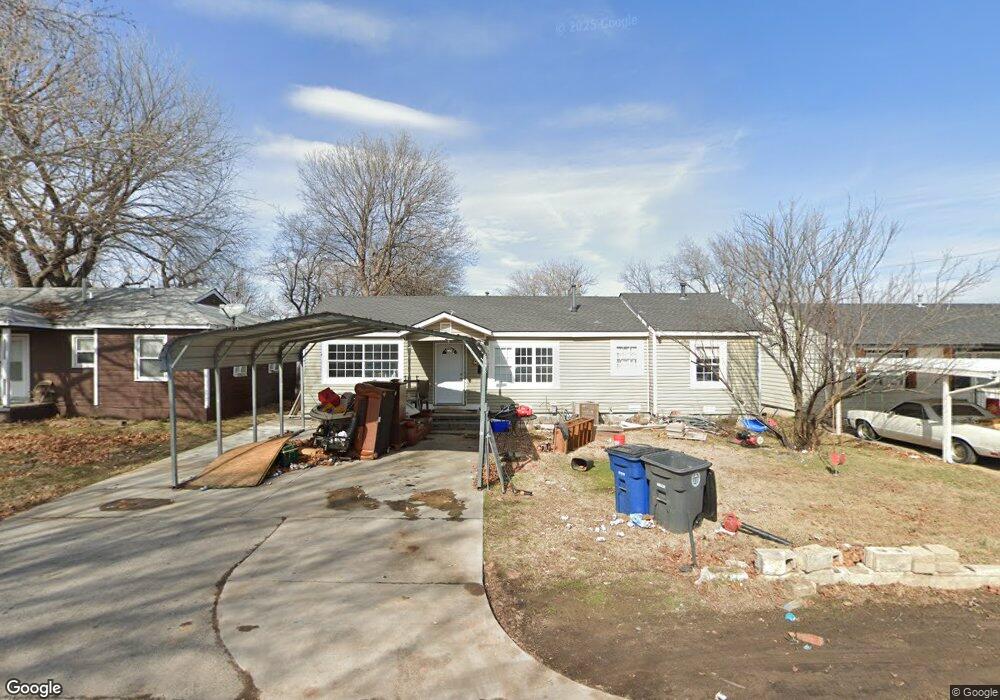
3225 E Xyler St Tulsa, OK 74110
North Evanston Place NeighborhoodEstimated Value: $122,000 - $145,000
--
Bed
1
Bath
1,445
Sq Ft
$93/Sq Ft
Est. Value
About This Home
This home is located at 3225 E Xyler St, Tulsa, OK 74110 and is currently estimated at $134,254, approximately $92 per square foot. 3225 E Xyler St is a home located in Tulsa County with nearby schools including Celia Clinton Elementary School, Monroe Demonstration Academy, and McLain High School of Science and Technology.
Ownership History
Date
Name
Owned For
Owner Type
Purchase Details
Closed on
Jun 8, 2023
Sold by
Urquiza Seberina
Bought by
Urquiza Eberardo Duarte
Current Estimated Value
Purchase Details
Closed on
Jun 7, 2023
Sold by
Urquiza Seberina
Bought by
Urquiza Eberardo Duarte
Purchase Details
Closed on
Sep 21, 2022
Sold by
Urquiza Seberina
Bought by
Urquiza Seberina and Duarte Eberardo
Purchase Details
Closed on
Sep 19, 2022
Sold by
Eberardo Duarte
Bought by
Urquiza Seberina
Purchase Details
Closed on
Jun 7, 2010
Sold by
Solis Claudia
Bought by
Duarte Everardo
Purchase Details
Closed on
Oct 10, 2000
Sold by
Duarte Everardo
Bought by
Solis Duarte Everado and Solis Duarte Claudia
Purchase Details
Closed on
Jun 23, 2000
Sold by
Hud
Bought by
Duarte Everardo
Purchase Details
Closed on
Jan 10, 2000
Sold by
Marshall Samuel Lee
Bought by
Hud
Purchase Details
Closed on
May 1, 1989
Purchase Details
Closed on
Sep 1, 1986
Create a Home Valuation Report for This Property
The Home Valuation Report is an in-depth analysis detailing your home's value as well as a comparison with similar homes in the area
Home Values in the Area
Average Home Value in this Area
Purchase History
| Date | Buyer | Sale Price | Title Company |
|---|---|---|---|
| Urquiza Eberardo Duarte | -- | None Listed On Document | |
| Urquiza Eberardo Duarte | -- | None Listed On Document | |
| Urquiza Seberina | -- | None Listed On Document | |
| Urquiza Seberina | -- | -- | |
| Urquiza Seberina | -- | -- | |
| Duarte Everardo | -- | None Available | |
| Solis Duarte Everado | -- | Delta Title & Escrow Company | |
| Duarte Everardo | -- | Frisco Title Corp | |
| Hud | -- | -- | |
| -- | $12,000 | -- | |
| -- | $38,500 | -- |
Source: Public Records
Tax History Compared to Growth
Tax History
| Year | Tax Paid | Tax Assessment Tax Assessment Total Assessment is a certain percentage of the fair market value that is determined by local assessors to be the total taxable value of land and additions on the property. | Land | Improvement |
|---|---|---|---|---|
| 2024 | $726 | $6,006 | $1,014 | $4,992 |
| 2023 | $726 | $5,720 | $1,111 | $4,609 |
| 2022 | $629 | $4,720 | $917 | $3,803 |
| 2021 | $623 | $4,720 | $917 | $3,803 |
| 2020 | $615 | $4,720 | $917 | $3,803 |
| 2019 | $647 | $4,720 | $917 | $3,803 |
| 2018 | $648 | $4,720 | $917 | $3,803 |
| 2017 | $647 | $5,720 | $1,111 | $4,609 |
| 2016 | $634 | $5,720 | $1,111 | $4,609 |
| 2015 | $635 | $5,720 | $1,111 | $4,609 |
| 2014 | $629 | $5,720 | $1,111 | $4,609 |
Source: Public Records
Map
Nearby Homes
- 2918 E Woodrow St
- 3546 E Xyler St
- 2017 N College Ave
- 2910 E Woodrow St
- 2901 E Virgin St
- 2137 N Louisville Ave
- 1823 N Harvard Ave
- 3904 E Young St
- 1645 N College Ave
- 1803 N Marion Ave
- 1836 N Oswego Ave
- 1825 N Delaware Ave
- 1819 N Oswego Ave
- 2723 E 27th St N
- 1525 N College Ave
- 1828 N Birmingham Ave
- 3203 E Oklahoma Place
- 1421 N Indianapolis Ave
- 1503 N Oswego Ave
- 1901 N Atlanta Ave
- 3229 E Xyler St
- 3219 E Xyler St
- 3215 E Xyler St
- 3228 E Young St
- 3232 E Young St
- 3222 E Young St
- 3209 E Xyler St
- 3222 E Xyler St
- 3226 E Xyler St
- 3216 E Young St
- 3216 E Xyler St
- 3212 E Xyler St
- 3203 E Xyler St
- 3210 E Young St
- 3206 E Xyler St
- 3219 E Woodrow Place
- 3223 E Woodrow Place
- 3211 E Woodrow Place
- 3207 E Woodrow Place
- 3149 E Xyler St